Unveiling the Precious Metal’s Potential in Your Portfolio
Silver, the lustrous metal, has captivated investors for centuries. But beyond its beauty, silver offers a unique blend of potential benefits for your portfolio. Let’s explore why you might consider adding silver to your investment mix, and then delve into the various ways to hold this precious metal.
The Allure of Silver
- Diversification: Silver’s price movements tend to have a low correlation to stocks and bonds. This means it can act as a hedge, potentially offsetting losses in other parts of your portfolio during economic downturns.
- Inflation Hedge: Silver, like gold, has historically held its value well against inflation. As the cost of living rises, silver’s price may follow suit, protecting your purchasing power.
- Industrial Demand: Silver’s industrial applications in solar panels, electronics, and medical devices create a constant demand stream, potentially influencing its price positively.
- Potential for Growth: Silver’s supply is finite, while demand is expected to rise, particularly in developing economies. This imbalance could lead to price appreciation in the long run.
- Affordable Entry Point: Compared to gold, silver offers a more accessible entry point for investors starting with precious metals.
Silver Investment Options: Weighing the Pros and Cons
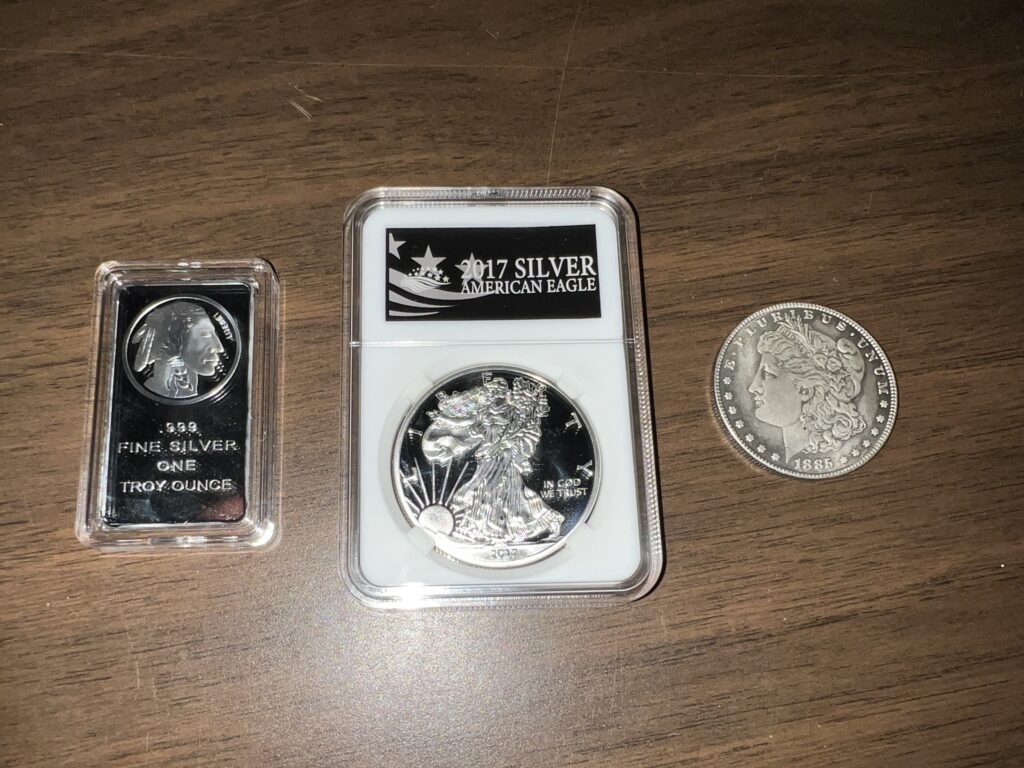
- PHYSICAL SILVER (Bullion & Coins):
- Pros: Tangible ownership, no counterparty risk, potential for collector’s value (for certain coins).
- Cons: Storage costs, insurance considerations, potential difficulty selling quickly.
- SILVER MINING STOCKS:
- Pros: Potential for higher returns due to leverage on the silver price, diversification within the precious metals sector.
- Cons: Higher risk compared to physical silver, volatility associated with the company’s performance.
- SILVER ETFs (Exchange Traded Funds):
- Pros: Low storage costs, fractional shares allow for easier investment amounts, high liquidity.
- Cons: You don’t own physical silver, expense ratios can eat into returns, counterparty risk associated with the ETF issuer.
The most popular silver ETF is the iShares Silver Trust (SLV), which has an objective of tracking the price of silver.
A Word about Silver Coins and Authenticity
Be careful about buying silver coins, as there are many fakes being distributed. These are not just the coins with numismatic value but also the so-called junk silver coins and even the bullion coins (silver rounds).
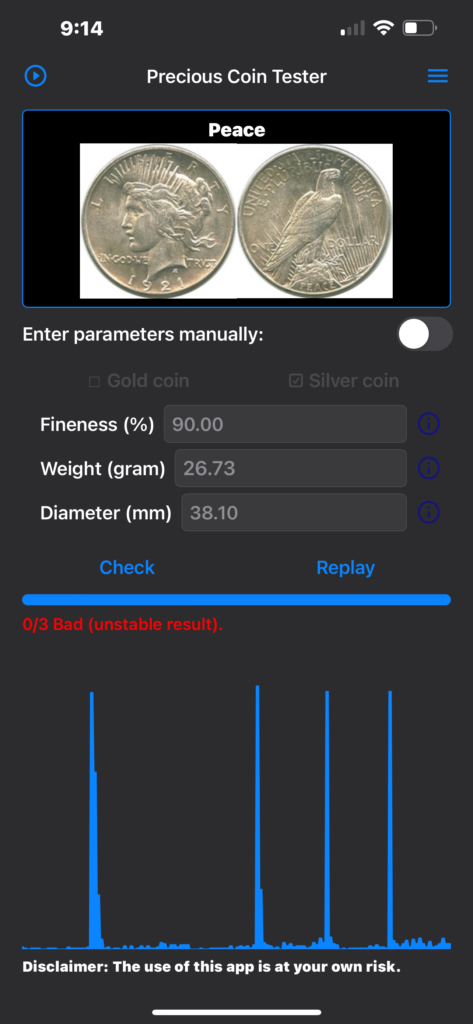
Fortunately, there are several ways of checking whether a coin is genuine or not. One simple way is to use a phone app called CoinTester. It measures the sound of the ping when the coin is hit with an object, like a pencil.
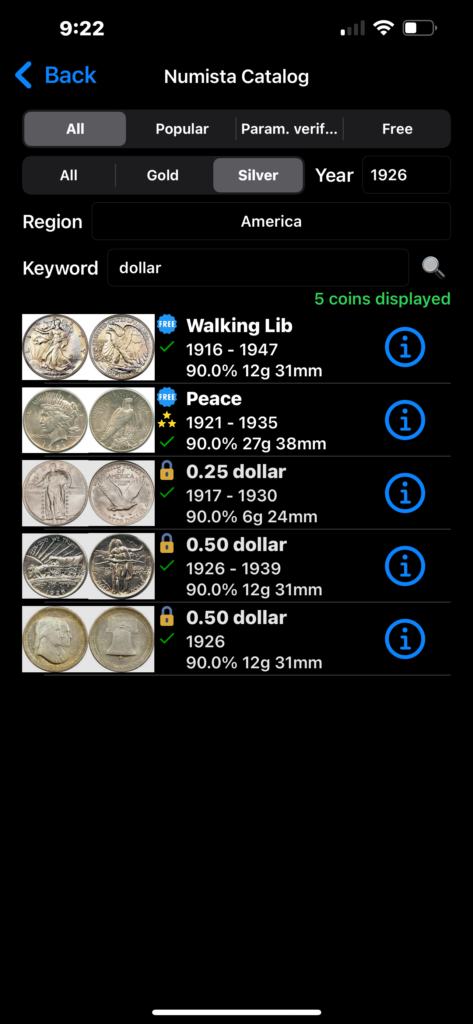
First, you choose the type of coin. (Note: If you are checking a silver dollar, for Keyword, just type Dollar, not Silver Dollar.) You place the coin on your fingertip, tap Check on the app, then hit the coin a few times with something that won’t damage the coin (I use the wooden part of a pencil.) If is shows a 0 or 1 out of 3, it means the coin is a fake. If it shows a 2 or a 3 out of three, the coin is real.
Just remember that all tests for coins aren’t foolproof. The best approach is to buy from a very reputable coin dealer.
Many numismatic coins are slabbed. In numismatics (the study or collection of coins), “slabbed” refers to the process of encapsulating a coin in a hard plastic holder, often called a slab. These slabs are usually sealed and graded by a professional coin grading service. The purpose of slabbing coins is to protect them from damage and to provide an objective assessment of their condition and authenticity.
When a coin is slabbed, it is typically accompanied by a label indicating its grade, which is determined based on factors such as wear, luster, strike quality, and any imperfections. This grading process helps collectors and investors assess the value of the coin and provides assurance about its authenticity and condition.
Slabbed coins are often considered more desirable for collectors and investors because they come with a trusted third-party evaluation, reducing the risk of buying counterfeit or over-graded coins.
The Final Shine
Silver offers a compelling option for investors seeking diversification, inflation protection, and potential growth. Carefully consider your investment goals and risk tolerance when choosing between physical silver, mining stocks, or ETFs. Remember, a well-rounded portfolio is key, and silver can be a bright addition to the mix.