Most experienced stock market traders and investors tend to ignore the Dow Jones Industrial Average because it is not a true indicator of what the market is doing and it can be skewed by higher priced stocks.
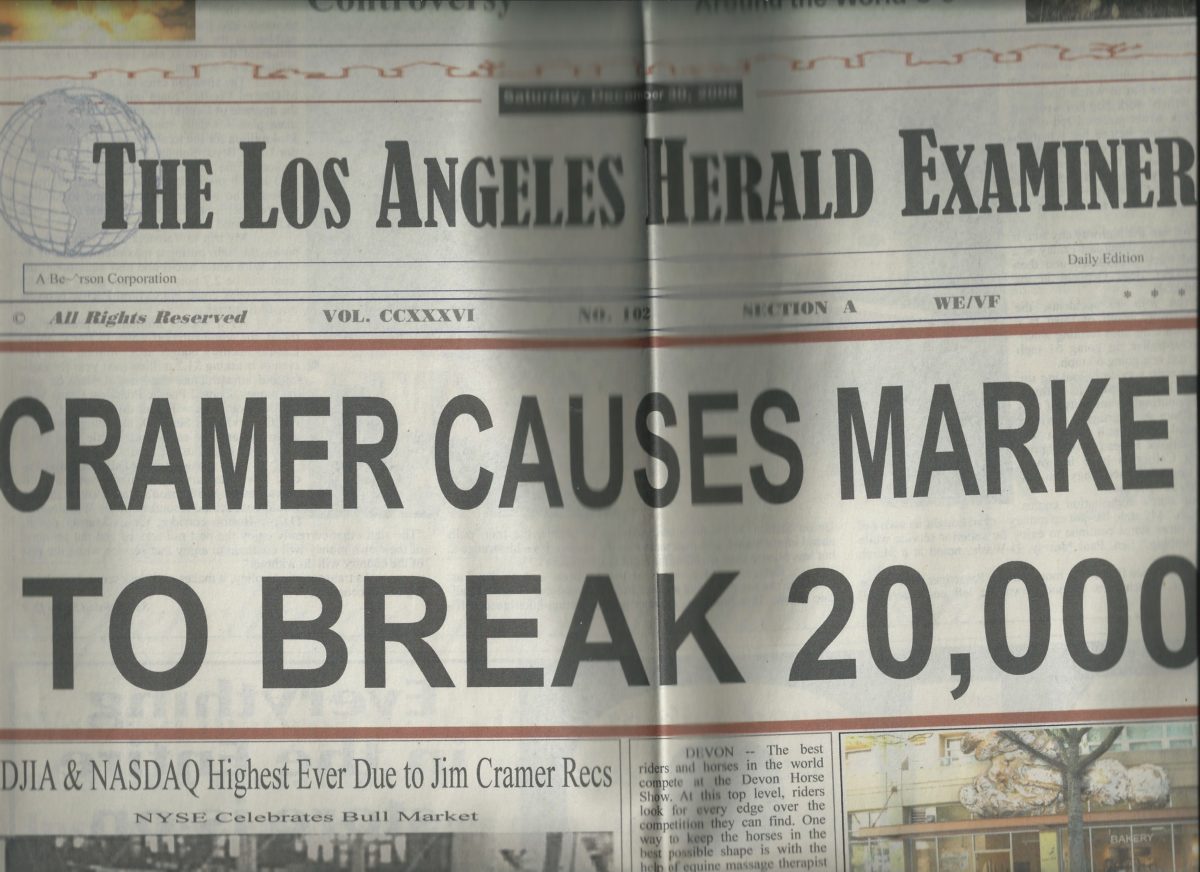
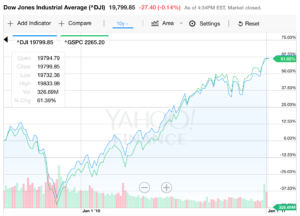
However the media likes to refer to the Dow for several reasons. First, this index has been around for many years (actually since 1896). Second, it is close to an all time high benchmark of 20,000. Third, even though the Standard & Poor’s 500 index may be a more accurate indictor of how the stock market is performing, the Dow is still closely correlated with the S&P 500. Check out the comparison in the graph below, courtesy of Yahoo! Finance.
The Dow Jones Industrial Average contains 30 stocks, which are currently as follows:
| American Express Co |
AXP |
| Apple Inc |
AAPL |
| Boeing Co |
BA |
| Caterpillar Inc |
CAT |
| Cisco Systems Inc |
CSCO |
| Chevron Corp |
CVX |
| E I du Pont de Nemours and Co |
DD |
| Exxon Mobil Corp |
XOM |
| General Electric Co |
GE |
| Goldman Sachs Group Inc |
GS |
| Home Depot Inc |
HD |
| International Business Machines Corp |
IBM |
| Intel Corp |
INTC |
| Johnson & Johnson |
JNJ |
| Coca-Cola Co |
KO |
| JPMorgan Chase & Co |
JPM |
| McDonald’s Corp |
MCD |
| 3M Co |
MMM |
| Merck & Co Inc |
MRK |
| Microsoft Corp |
MSFT |
| Nike Inc |
NKE |
| Pfizer Inc |
PFE |
| Procter & Gamble Co |
PG |
| Travelers Companies Inc |
TRV |
| UnitedHealth Group Inc |
UNH |
| United Technologies Corp |
UTX |
| Verizon Communications Inc |
VZ |
| Visa Inc |
V |
| Wal-Mart Stores Inc |
WMT |
| Walt Disney Co |
DIS |
So what is really wrong with the Dow? It is a price-weighted average, which means that the 30 stocks in the index are added up, then divided by a divisor, in order to account for stock splits and stock dividends. This means that a higher priced stock, such as Goldman Sachs (GS) which currently sells for over $230 a share can have a greater affect on the index than a lower priced stock, such as General Electric (GE), which sell for less than $30 a share.
The Dow differs from the S&P 500 in that the S&P is weighted by the market capitalization of all the companies in its index. The market cap for this index is calculated by multiplying the price per share times the float (shares available for trading).
Now you might ask, why is this all a big deal with the Dow being price weighted.? Here is one example. Because Goldman Sachs is the highest priced stock in the index, it can affect the Dow significantly. Let’s say that all the stocks in the Dow stay the same, but the price of Goldman drops from 232 to 200, or 150, or even 100. After all, it traded for less than 100 five years ago. In that case, the Dow would drop from about 19,800 to 18,891.
Of course, if Goldman goes up in price significantly, even if the other stocks in the Dow remain the same, the Dow average will increase dramatically.
Now lets say that GE drops by about the same percentage from 29 to 13, and all the other stocks, including Goldman, don’t change from today’s price. The Dow index would only drop from 19,800 to 19,685.
There are several ways that traders can use this information including using Dow related ETFs, such as the SPDR Dow Jones Industrial Average ETF, in conjunction with or as an alternative to Goldman Sachs. There is also the ProShares Ultra Dow30ETF (DDM), which has a goal of providing twice the return of the Dow. The ProShares UltraPro Dow30 ETF (UDOW) has triple leverage.
On the bearish side, there is the ProShares Short Dow30 ETF (DOG), which has a goal of providing an inverse performance of the Dow, the ProShares UltraShort Dow30 ETF (DXD) providing two times the inverse of the Dow, and the ProShares UltraPro Short Dow30 ETF (SDOW), which is a triple inverse of the Dow ETF.
So let’s say you think that Goldman Sachs is going to drop in price. You could short the stock, but you would have unlimited risk if you are wrong. Or you could buy the SDOW ETF where your risk would be spread among the 30 stocks and your potential loss would be limited to what you invest.
The reverse of the trade could also be done. Suppose you think that Goldman Sachs is going to 400. You could buy the UDOW ETF instead, and have the diversification of the 30 stocks, and still get decent upside if you are right about Goldman because of the amount of weight it has on the index.
Or you could have a long or short position in Goldman and at the same time, have an opposite position in the Dow using an ETF, in order to hedge yourself. I will leave it up to you to determine your own best strategy.
In order to see what the Dow index can do based on various changes in stock prices, we have provided a Free Dow Jones Industrial Average Analyzer, in the form of an Excel spreadsheet, which will allow you to do what-ifs to see what would happen if, say, Apple (AAPL) goes to 150 and Wal-Mart (WMT) goes to 100.
Or maybe you want to go through the list of all 30 stocks and enter how far you think they could possibly drop, then determine what the Dow index would be. Another option would be to play around with the stock prices to see what would be required for the Dow Jones Industrial Average to reach 20,000.
To see the analyzer, click on the link below:
Free Dow Jones Industrial Average Analyzer