NYSE Stocks with the Highest Short Interest

by Fred Fuld III

A short squeeze is a phenomenon that occurs in financial markets when investors who have sold shares of a stock short (i.e., betting that the stock price will fall) are forced to buy those shares back at a higher price than they expected. This can happen when the stock’s price rises sharply, causing losses for short sellers who need to buy the stock to cover their position and limit their losses.

As more and more short sellers try to buy the stock to close out their positions, this increased buying activity can drive the stock price even higher, creating a feedback loop that can lead to a rapid and dramatic increase in price. This can create a challenging situation for short sellers, who may be forced to buy back the stock at a loss, or risk even greater losses if the stock continues to rise. A short squeeze can also create opportunities for long investors who have purchased the stock, as they may be able to sell their shares at a higher price to short sellers looking to cover their positions.

On August 22, 2022, I posted an article about meme related short squeeze stocks, and pointed out Bed Bath and Beyond (BBBY) after it had its big run-up. In exactly one week after the article was posted, the stock jumped by more than 43%.

Another stock that was mentioned was Intercept Pharmaceuticals, Inc. (ICPT), which increased by almost 5% in just two days.

The stock with the biggest short ratio (days to cover), at 14.3 back then, was Heron Therapeutics, Inc. (HRTX). It rose by 9.5% in three days.

When you short a stock, it means that your goal is to make money from a drop in the price of a stock. Technically, what happens is that you borrow shares of a stock, sell those shares, then buy back those shares at a hopefully lower price so that those shares can be returned. This all happens electronically, so you don’t actually see all the borrowing and returning of shares; it just shows up on your screen as a negative number of shares.

Short sellers can be profitable, but sometimes when the stock moves against them, and begins to rise, the short sellers jump in right away to buy shares to cover their positions, creating what is called a short squeeze. When a short squeeze takes place, it can cause the share prices to increase fast and furiously. Any good news can trigger the short squeeze.

Some traders utilize this situation by looking for stocks to buy that may have a potential short squeeze. Here is what a short squeeze trader should take into consideration:

Short Percentage of Float ~ The float is the number of freely tradable shares and the short percentage is the number of shares held short divided by the float. Amounts over 10% to 20% are considered high and potential short squeeze plays.

Short Ratio / Days to Cover / Short Interest Ratio -This is probably the most important metric when looking for short squeeze trades, no matter what you call it. This is the number of days it would take the short sellers to cover their position based on the average daily volume of shares traded. This is a significant ratio as it shows how “stuck” the short sellers are when they want to buy in their shares without driving up the price too much. Unfortunately for the shortsellers, the longer the number of days to cover, the bigger and longer the squeeze.

Short Percentage Increase ~ This is the percentage increase in in the number of short sellers from the previous month.

The following are some heavily shorted tech stock that may be worth considering.

CompanyTickerShort % of FloatShort % ChangeShort Interest Ratio
Silvergate Capital CorpSI76.92%-6%1.2
Carvana CoCVNA52.82%0%1.8
Wayfair IncW33.65%0%4.2
Big Lots, Inc.BIG32.44%-1%7
C3.ai IncAI27.31%5%1.4
Fubotv IncFUBO26.57%-27%3.2
Virgin Galactic HoldingsSPCE25.92%9%5.9
Bakkt Holdings IncBKKT24.53%6%4.3
AMC EntertainmentAMC24.39%1%3.7
Cinemark Holdings, Inc.CNK23.73%0%7.6

The third stock on the list, Wayfair (W) has over 33% of its float shorted, with no change in short interest over last month.

The short interest ratio is 4.2, which means that it would take the short sellers over 4 days to cover their position, based on recent average volume.

Just keep in mind that just because a stock has good earnings ratios and is heavily shorted, doesn’t mean that the stock will go up, especially in a bear market. Also, stocks that are significantly shorted may be shorted for a reason.

Disclosure: Author didn’t own any of the above at the time the article was written.

Will Movie Theater Stocks Become Blockbusters?

People are going back in to the movie theaters to see the big screen. Over Christmas weekend, Avatar: the Wave of Water pulled in $64,000,000 in box office gross, and has brought in a total gross of $261,681,686 so far.

by Fred Fuld III

Over Christmas weekend, Avatar: the Wave of Water pulled in $64,000,000 in box office gross, and has brought in a total gross of $261,681,686 so far.

Puss in Boots: The Last Wish generated $12,420,000, Whitney Houston: I Wanna Dance with Somebody sold $4,765,000, and Babylon brought in $3,600,000 over the same weekend.

People are going back in to the movie theaters to see the big screen.

Unfortunately for the theater companies, their performance over the last year has been miserable.

For example, Cinemark (CNK) has dropped by 46% year to date and is down over 20% just in the last week.

However, Texas based Cinemark,  operates over 500 theaters with more than 5,800 screens in the United States, and South and Central America. 

The stock has a forward price to earnings ratio of 23, and has an earnings per share expected growth rate 0f 127% next year. Quarterly revenue growth was 49.6% year over year.

It also has a very favorable price to sales ratio of 0.45. (Remember, a P/S of less than 1 is good, above 2 is not so good.)

Marcus (MCS), which owns and operates movie theaters, along with hotels and resorts, is down 22% so far year to date.

Marcus has a nosebleed high P/E ratio of 422, but a more reasonable forward P/E of 26. Earnings per share this year were up 70.4%.

The price sales ratio is a great 0.64, and the stock is even selling below book value with a price to book of 0.96.

The stock even pays a dividend with a yield of 1.44%.

There is also Reading International (RDI), the owner of theater chains, which is down 30%, and of course the famous meme stock, AMC Entertainment (AMC) which has tanked by 74% this year.

StockSymbolYTD Price
AMC EntertainmentAMC-74%
CinemarkCNK-46%
MarcusMCS-22%
Reading InternationalRDI-30%
IMAXIMAX-22%

Will any of these stocks bounce after year end tax selling? It is impossible to know, but maybe one of these will win an award for Best Stock.

Disclosure: Author didn’t own any of the above at the time the article was written.

How Did the Meme Stocks Do Last Year? Here’s How

by Fred Fuld III

About a week ago, I heard an analyst on CNBC being interviewed about meme stocks, although he didn’t pronounce it “meeem”, he pronounced it “me-me”. Do you think it was accidental, through ignorance, or on purpose with a hidden meaning?

Whatever you call them, the meme stocks have had a wild ride last year. Surprisingly, a few of them performed extremely well, but many ended up dropping over 40% for the year.

Interestingly, the top performers were GameStock, I mean GameStop (GME) (did I type it that way accidentally or on purpose?), up 688%, and AMC Entertainment (AMC), which rose by 1183%.

The memes that tanked the most were Clovis (CLOV) down 78% and ContextLogic Inc. (WISH), which dropped by 83%.

The following is a list of the meme stocks and semi-meme stocks along with the January 1 to December 31 performance for the year 2021.

GME 688%
AMC 1183%
CLOV -78%
CRON -43%
DASH 4%
FVRR -42%
HOOD -49%
IQ -74%
OTLY -61%
WE -27%
WISH -83%
BB 41%
SNDL 22%
BYND -48%
SLV -12%

Maybe we will see some meme action again this year. What do you think?


Disclosure: Author owns SLV and HOOD.

Heavily Shorted Debt Free Stocks

by Fred Fuld III

Many of the meme stocks, such as GameStop (GME) and AMC (AMC), have shot up in price several times because of the fact that they have been heavily shorted and subject to a short squeeze.

So if you are looking for other heavily shorted stocks, you might want to check out the stocks which have a large portion of their float shorted, and in addition, have low or no debt. If a company has no debt, it is hard for them to go out of business.

Here is a review of the short squeeze and its terminology. When you short a stock, it means that your goal is to make money from a drop in the price of a stock. Technically, what happens is that you borrow shares of a stock, sell those shares, then buy back those shares at a hopefully lower price so that those shares can be returned. This all happens electronically, so you don’t actually see all the borrowing and returning of shares; it just shows up on your screen as a negative number of shares.

Short selling can be profitable, but sometimes when the stock moves against the short sellers, and begins to rise, the short sellers jump in right away to buy shares to cover their positions, creating what is called a short squeeze. When a short squeeze takes place, it can cause the share prices to increase fast and furiously. Any good news can trigger the short squeeze.

Some traders utilize this situation by looking for stocks to buy that may have a potential short squeeze. Here is what a short squeeze trader should take into consideration:

Short Percentage of Float ~ The float is the number of freely tradable shares and the short percentage is the number of shares held short divided by the float. Amounts over 10% to 20% are considered high and potential short squeeze plays.

Short Ratio / Days to Cover / Short Interest Ratio -This is probably the most important metric when looking for short squeeze trades, no matter what you call it. This is the number of days it would take the short sellers to cover their position based on the average daily volume of shares traded. This is a significant ratio as it shows how “stuck” the short sellers are when they want to buy in their shares without driving up the price too much. Unfortunately for the shortsellers, the longer the number of days to cover, the bigger and longer the squeeze.

Short Percentage Increase ~ This is the percentage increase in in the number of short sellers from the previous month.

Check out the following list, but be aware, that often some stocks are heavily shorted for a reason. All these stocks have significant short metrics.

Big 5 Sporting Goods (BGFV) has over 45% of its float shorted and no long term debt. The percentage shorted has increased by 15% over last month. In addition, the stock has a short interest ratio, also known as a Days to Cover Ratio, of 5.9. This means that it would take almost six days for short sellers to cover their position, based on recent volume. The stock trades at 5.5 times trailing earnings. It is a sporting goods retailer in the western United States.

OppFi Inc. (OPFI) has 12.3$ of its float shorted. The short entered has had a one month increase of 6% and a short interest ratio of 4.4. The company operates a financial technology platform.

Sunlight Financial Holdings (SUNL) is another debt free company that has over 10% of of its float shorted. The percentage shorted has increased by 9% over last month. Plus, the stock has a short interest ratio of 6.0. The company provides a financing platform for solar installation.

Happy squeezing!

Robinhood Investors Getting Rich

by Fred Fuld III

Last Thursday, Robinhood (HOOD) went public at an IPO price of $38 per share. The stock sold off a little that first day, but today, the stock reached a price per share of $85 shortly after the stock market opened.

This works out to a 123% gain in one week. Not too shabby for a recent IPO.

Even if you had waited until yesterday to buy the stock on the close at $48.50, the gain would be 75%.

Robinhood has almost turned into a meme stock, not due to a short squeeze but do to the popularity of the stock, as it has garnered much attention on Reddit.

Options started trading on the stock today, and the volume and activity is huge. The strike prices range from 20 to 95 for all expirations from August to January of next year. Will higher strikes need to be added? Who knows? Maybe even lower strikes.

The August implied volatility is over 200% and September is in excess of 170%.

It will be interesting to see if Robinhood turns into another GameStop (GME) or AMC (AMC), or if it takes you for a RIDE.


Disclosure: Author owns two shares of HOOD.


Weirdest Wall Street Stuff on Amazon

by Fred Fuld III

Are you looking for a great joke gift for a stock trader friend? Or maybe just a funny gift for your father who likes to invest, and you need to come up with a present for Father’s Day. Then again, you could just be looking for something for yourself to prove what a great trader or investor you are.

If so, there is a great selection of unusual  items on Amazon related to investing and the stock market. Here is an interesting list of the out-of-the-ordinary.

Rocket Ship WSB Wall Street Bets Stock Market T-Shirt

If you made money on GameStop (GME), why not show it off with this attention getting WallStreetBets To the Moon T-Shirt.


Wolf of Wall Street Poster

Here’s an unusual one. A framable quote from Jordan Belfort, the Wolf of Wall Street.


Miniature ATM

All right, it’s not a real ATM. It’s basically a kid’s piggy bank, but instead of being in the shape of a pig, it is in the shape of a bank vault with keypads and everything. A unique gift for a child.

Stock Market Decision Maker

If you can’t figure out which way the stock market is going, check out this desk paperweight stock market decision maker that might just tell you whether to buy, sell, short, hold, and so on. Makes a great icebreaker for visitors to your office.


Are you made of money?

People might think so if they look below your pant cuffs and see socks with money raining down.


Show that You’re the Godfather of Stocks

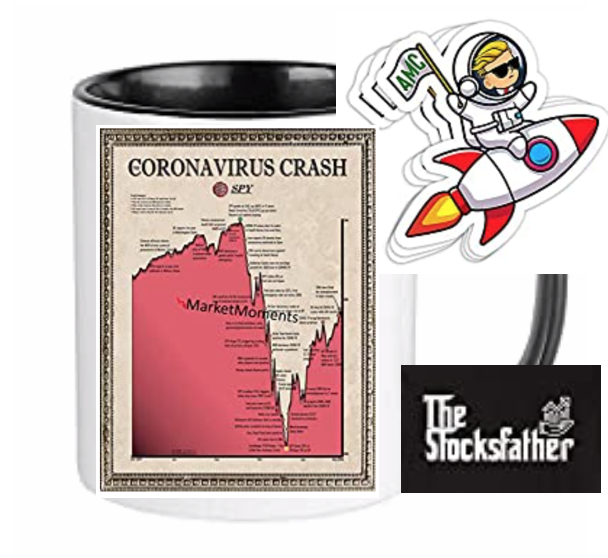
If your father trades stocks, this might be the perfect Fathers Day gift, a T-shirt that says The Stocksfather.


COVID Stock Market Chart

Now here’s a chart that you won’t see every day. A graph of the SPY from December 2019 to May 2020, showing the Coronavirus Crash.


Show the World that you Trade While You Drive

This is a chrome plastic license plate frame that proclaims that you would much rather be watching the stock market.


Thank You AMC Stonk to The Moon Stickers

Here are three stickers for those that made money from  AMC (AMC). Put them on your laptop, your front door, your car, your water bottle, your face, or wherever.


Are You a Stock Market Genius?

This Stock Market Genius coffee mug is great for braggarts.


What Guy Wouldn’t want a Throw Pillow?

This is a Buy the Fear, Sell the Greed throw pillow, great for punching or throwing if you make a trading mistake.


Bull and Bear Bronze Statue with a Twist

You have probably seen several of this statues showing a bull and a bear. This one is a little different. The bull is goring the bear, and look at the bear’s expression.

Hopefully you can find some great unusual, weird, strange, investment related gifts for yourself, family, and friends.


This article and page contains affiliate links.

AMC Doubled Today: What About the Other Movie Theater Stocks?

by Fred Fuld III

In case you missed it, the stock price of AMC Entertainment (AMC), the company that owns the chain of movie theaters, doubled today.  Well, OK, it was up only 95.22%, but it is up another 5.20% in after market trading, as I am writing this.

AMC chart

To think that you could have both AMC for $2 a share back in January, and now it is over $62.

Of course, AMC is one of the “stonks”, a stock that has a large group of traders buying the stock to take advantage of the fact that the stock is heavily shorted, creating a major short squeeze. So the substantial increase today has nothing to do with the company’s earnings, revenues, or anything else.

However, it does point out the fact that the number of American’s that have been vaccinated has been on the rise and the COVID-19 infection rate is dropping. It also means that people are more willing to get out and go to a movie theater. Especially a nice air conditioned theater during the hot summer.

Cinemark Holdings Inc. (CNK), based in Plano, Texas, operates over 500 theaters. It has a market cap of $3 billion, and is generating negative earnings. It does not pay a dividend.

The Marcus Corporation (MCS) owns theaters in 17 states with the brands Marcus Theatres, Movie Tavern by Marcus, and BistroPlex. Earnings are currently negative. It has a market cap of $710 million.

Cineworld Group PLC ( CNNWF) is a UK based company that operates such theater chains as Regal, United Artists, Edwards theatres, Cineworld, and Picturehouse. Earnings are currently negative. The market cap is $1.8 billion.

IMAX Corporation (IMAX) offers theater software and equipment to theaters. Earnings are currently negative. The stock trades at 25.7 time forward earnings, and does not pay a dividend. IMAX has a market cap of $1.3 billion.

Let’s see if any of these stocks become blockbusters.

Disclosure: Author didn’t own any of the above at the time the article was written.

Top Low Priced Short Squeeze Stocks

by Fred Fuld III

Unless you haven’t paid any attention to financial news at all, you probably already know that GameStop (GME) has gone up over 700% in the last five days. The movie theater chain, AMC (AMC) was available for a little over two bucks ten days ago. Today, it traded for 25.80 this morning in pre-market trading.

You also probably know that these huge gains have been caused by short squeezes.  Back on September 18 last year, I published an article called Top Restaurant Short Squeeze Stocks, and it listed four companies that were heavily shorted. In just the last four months, those stocks have had stellar returns.

The worst performing stock was up 38%. Not a bad return for four months. The best performing was Dave & Busters (PLAY), which was up 138%. Here are those four stocks, with the percent of float shorted at the time, the days to cover at the time, and the return if you had bought the stock back then and sold today.

Stock Symbol % of Float Days to Cover % Gain
Shake Shack SHAK 26% 5.7 85%
Dave & Buster’s PLAY 33% 1.8 136%
Red Robin RRGB 35% 3.4 64%
El Pollo Loco LOCO 19% 11.2 38%

Many of the heavily shorted stocks you have seen on the news during the last couple days are high priced, with a majority of them trading over $100 a share. That’s a lot of risk. So If you are looking for low priced stocks that might be short squeeze plays, I will cover that shortly.

But first, a review about the short squeeze and its terminology. When you short a stock, it means that your goal is to make money from a drop in the price of a stock. Technically, what happens is that you borrow shares of a stock, sell those shares, then buy back those shares at a hopefully lower price so that those shares can be returned. This all happens electronically, so you don’t actually see all the borrowing and returning of shares; it just shows up on your screen as a negative number of shares.

Short selling can be profitable, but sometimes when the stock moves against the short sellers, and begins to rise, the short sellers jump in right away to buy shares to cover their positions, creating what is called a short squeeze. When a short squeeze takes place, it can cause the share prices to increase fast and furiously. Any good news can trigger the short squeeze.

Some traders utilize this situation by looking for stocks to buy that may have a potential short squeeze. Here is what a short squeeze trader should take into consideration:

Short Percentage of Float ~ The float is the number of freely tradable shares and the short percentage is the number of shares held short divided by the float. Amounts over 10% to 20% are considered high and potential short squeeze plays.

Short Ratio / Days to Cover / Short Interest Ratio -This is probably the most important metric when looking for short squeeze trades, no matter what you call it. This is the number of days it would take the short sellers to cover their position based on the average daily volume of shares traded. This is a significant ratio as it shows how “stuck” the short sellers are when they want to buy in their shares without driving up the price too much. Unfortunately for the shortsellers, the longer the number of days to cover, the bigger and longer the squeeze.

Short Percentage Increase ~ This is the percentage increase in in the number of short sellers from the previous month.

Check out the following list, but be aware, that often some stocks are heavily shorted for a reason. All these stocks have significant short metrics.

Stock Symbol % of Float Days to Cover Stock Price
Ayro AYRO 23.28% 0.51 7.24
Clovis Oncology CLVS 42.43% 6.54 7.94
Senseonics SENS 30.95% 1.36 2.51
TherapeuticsMD TXMD 28.89% 14.30 1.59
VBI Vaccines VBIV 25.64% 6.62 3.15

So as an example, VBI Vaccines has over 25% of the float shorted, and it will take over six days for the short sellers to cover their positions, based on the average daily volume.

Obviously, there is no guarantee that these stocks will go up, but if I was short any stock selling for less than $10 a share, I wouldn’t want to waste any time covering my position, before all the other short sellers clamor in and drive the price way up.

Disclosure: Author owns TXMD. No recommendations are express or implied.


Stocks Going Ex Dividend the First Week of December

Here is our latest update on the stock trading technique called ‘Buying Dividends,’ also commonly referred to as ‘Dividend Capture.’ This is the process of buying stocks before the ex dividend date and selling the stock shortly after the ex date at about the same price, yet still being entitled to the dividend. This technique generally works only in bull markets, and can work in flat or choppy markets, but you need to avoid the technique during bear markets.

In order to be entitled to the dividend, you have to buy the stock before the ex-dividend date, and you can’t sell the stock until after the ex date. The actual dividend may not be paid for another few weeks.

WallStreetNewsNetwork.com has compiled a downloadable and sortable list of the stocks going ex dividend in the near future. The list contains many dividend paying companies, lots with market caps over $500 million, and yields over 2%. Here are a few examples showing the stock symbol, the ex-dividend date, the dividend amount, and yield.

AMC Entertainment Holdings, Inc. (AMC) 12/1/2016 0.20 2.3%
Anthem, Inc. (ANTM) 12/1/2016 0.65 1.8%
Calgon Carbon Corporation (CCC) 12/1/2016 0.05 1.1%
Cedar Fair, L.P. (FUN) 12/1/2016 0.86 5.7%
H&R Block, Inc. (HRB) 12/1/2016 0.22 3.7%
Jack In The Box Inc. (JACK) 12/1/2016 0.40 1.5%
Nike, Inc. (NKE) 12/1/2016 0.18 1.4%

The additional ex-dividend stocks can be found here at wstnn.com. (If you have been to the website before, and the latest link doesn’t show up, you may have to empty your cache.) If you like dividend stocks, you should check out some of the other high yield stock lists at WallStreetNewsNetwork.com or WStNN.com. Most of the lists are free.

Dividend definitions:

Declaration date: the day that the company declares that there is going to be an upcoming dividend.

Ex-dividend date: the day on which if you buy the stock, you would not be entitled to that particular dividend; or the first day on which a shareholder can sell the shares and still be entitled to the dividend.

Monthly Dividend Stock List

Record date: the day when you must be on the company’s books as a shareholder to receive the dividend. The ex-dividend date is normally set for stocks at two business days before the record date.

Payment date: the day on which the dividend payment is actually made, which can be as long at two months after the ex date.

Book now available: Buying Dividends Revised and Expanded

Book now available: Stock Market Trivia Makes a Great Gift!
Don’t forget to reconfirm the ex-dividend date with the company before implementing this technique.

Disclosure: Author did not own any of the above at the time the article was written.