How to Spot Potential Short Squeeze Opportunities on the NASDAQ

Ever found yourself shorting a stock only to see a sudden spike, prompting an urgent need to cover your position as soon as possible?

What happened was called a Short Squeeze. Even the most seasoned traders have experienced this phenomenon. But do they really know what happened? 

A short squeeze happens when a heavily shorted stock has a shape increase in buying volume causing short sellers to close out their positions, which drives the prices higher from the covers. As you have read in a previous article about NYSE Squeezes, NASDAQ is home to many short squeezes as well. 

The most famously known NASDAQ short squeeze is GameStop (GME) in 2021. GameStock is a brick and mortar gaming merchandise retailer that had declining sales, which caused investors to heavily short the stock. GameStop had more shares sold short than the total number of shares available for trading (a situation known as a “short interest”). 

A group of retail investors on the Reddit forum r/WallStreetBets noticed that GameStop was heavily shorted and began buying the stock which started driving up the stock price. As the aggressive buying started to surge, this put pressure on the short sellers to cover their positions (buying back at higher prices to limit the losses). 

The unprecedented surge in GameStop’s stock price caused extreme volatility and attracted widespread media attention. The GameStop short squeeze had significant repercussions in the financial markets, leading to losses for some hedge funds that had heavily shorted the stock and prompting scrutiny from regulators and lawmakers. It also sparked a broader interest in retail trading and the democratization of investing. 

Some traders utilize this situation by looking for stocks to buy that may have a potential short squeeze. Here is what a short squeeze trader should take into consideration:

Short Percentage of Float refers to the proportion of shares held short divided by the total float, where the float represents freely tradable shares. A short percentage exceeding 10% to 20% is typically regarded as high and may indicate potential short squeeze opportunities.

The Short Ratio, also known as Days to Cover or Short Interest Ratio, is a crucial metric in identifying potential short squeeze opportunities. It represents the number of days it would take for short sellers to buy back their positions based on the average daily trading volume of shares. This ratio is significant because it indicates the level of difficulty short sellers face when attempting to cover their positions without significantly impacting the stock price. However, for short sellers, a higher number of days to cover implies a greater and more prolonged squeeze, increasing their potential losses.

Short Percentage Increase refers to the percentage growth in the number of short sellers compared to the preceding month.

The following are some heavily shorted NASDAQ stocks that may be worth considering for a short squeeze.

CompanyCompany SymbolShort InterestShort % ChangeShort Interest Ratio
Novavax IncNVAX41.58%5%6.4
Beyond Meat IncBYND37.86%1%7.8
Immunitybio IncIBRX36.07%7%11.4
Upstart Holdings IncUPST35.63%-11%2.6
Luminar Technologies IncLAZR35.28%13%11.6
Prime Medicine IncPRME34.06%-7%3.9
Blink Charging CoBLNK32.27%-1%2.3

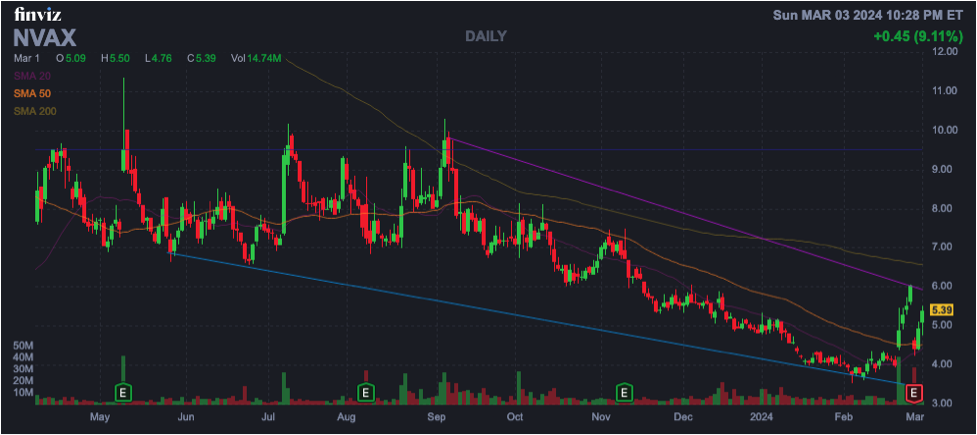
The first stock on the list, Novavax Inc (NVAX) has over 41% of its float shorted, an increase of 5% over last month. The short interest ratio is 6.4, which means that it would take the short sellers over six days to cover their position, based on recent average volume. Take a look at the chart below, you can see increased volume in the past few days…

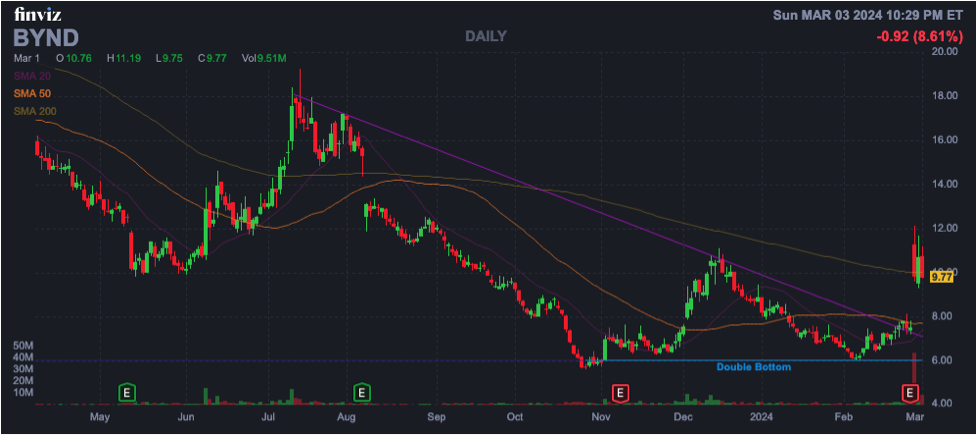
The second stock on the list, Beyond Meat Inc. (BYND) has over 37% of its float shorted, an increase of 1% over last month. The short interest ratio is 7.8, which means that it would take the short sellers over seven days to cover their position, based on recent average volume. As you can see here, it looks like BYND may have been squeezed.

The last stock on the list, Blink Charging Co. (BLNK) has over 32% of its float shorted, an decrease of 1% over last month. The short interest ratio is 2.3, which means that it would take the short sellers over two days to cover their positions, based on recent average volume. 

Although a stock may exhibit favorable ratios and attract significant short interest, it’s crucial to recognize that these factors alone do not guarantee an upward movement in its price, particularly in a bear market. Additionally, high levels of short interest in a stock could signal underlying issues or concerns that have prompted investors to bet against its performance.

Don’t forget to subscribe to our newsletter in order to become aware of the latest investment opportunities.

Disclosure: Author had no positions in any of the above at the time the article was written.

Statistics: Gold versus the Stock Market This Century

by Fred Fuld III

It may look like gold hasn’t been doing much of anything recently. Even for the last twelve months, gold has been relatively flat.

So what about long term. Can gold outperform the stock market over a long period of time?

Of course, it depends on the time frame, but let’s look at this century, beginning January 3, 2000 (the first business day of the year).

Based on that time frame, gold has far outperformed the various stock indices, including the S&P 500, the NASDAQ, and the Dow Jones Industrial Average.

As a matter of fact, gold has increased by 558% over that time, versus 329% for the S&P 500 as measured by the SPDR SPY ETF (SPY), which was only up 329%. This includes dividends for the SPY.

The statistics for the returns are below, which also include the Dow and the NASDAQ.

Gold versus Stocks This Century
Percentage increase in price from January 3, 2000 to the present
Dow Jones Industrial Average 190%
S&P 500 as measured by SPY 329%
NASDAQ as measured by QQQ 276%
Gold price per ounce 558%
* Adjusted for splits and dividend and/or capital gain distributions
Sources: Yahoo!Finance historical data, sdbullion.com

Is gold in your portfolio?

Wouldn’t It Be Great If You Could Track the Retail Trading Activity of the Top 10 Stocks for Free? Well You Can

by Fred Fuld III

I’ve always thought it would be great to know what retail investors are doing with popular stocks. Are the buying or selling? This would be especially useful with the meme stocks.

Well guess what. You can now get this information, from NASDAQ, which is offering the Retail Trading Activity Tracker.

The price for this service? Free! Of course, there is a premium service which allows you to access a lot more information.

What does it give you?

The Activity, which is the Ratio of money traded by retail investors in a given stock divided by total amount of money traded by retail investors across all stocks. The amount ranges from 0 to 1.

It also gives you the Sentiment Score, which is the retail net flows of buy vs. sell of the most recent 10 trading days. The value ranges from +100 to -100, where the more positive the score, the greater the proportion of recent retail net buying, and the more negative the score,  the greater the proportion of recent retail net selling.

What a great service from NASDAQ .

Year End Stock Market Holidays

If you are interested in knowing whether or not the stock market will be open on Veterans Day (November 11) or the day after Thanksgiving (November 26) or another of the other days that are coming up before the end of the year, you have come to the right place.

You might want to bookmark the following:

Holiday Day NYSE NASDAQ
Veterans Day Thursday, November 11 Open Open
Thanksgiving Day Thursday, November 25 Closed Closed
Day After Thanksgiving Friday, November 25 Early close   1 pm ET, 10 am PT Early close   1 pm ET, 10 am PT
Christmas Day observed (Christmas Eve) Friday, December 24 (Christmas holiday observed) Closed Closed
New Years Eve Friday, December 31 Open Open
New Year’s Day 2022 Saturday, January 1, 2022 Closed (Saturday normally closed) Closed

Happy Holidays!!!

How many stocks are there?

by Fred Fuld III

If you have ever wondered how many stocks there are in the United States, here is your answer.

As of today, there are 25,274 different stocks traded The following is the breakdown.

NYSE 3,850
NASDAQ 3,828
AMEX 549
OTCQX 598
OTCQB 1,091
Pink Sheets 11,179
Expert Market 830
Grey Market 3,349
TOTAL 25,274

OTCQX stocks are more established large companies that trade over-the-counter. This includes such companies as adidas (ADDYY), Greyscale Bitcoin Trust (GBTC), and Heineken (HKHHY). Many foreign companies are traded in the market.

OTCQB stocks are entrepreneurial and venture capital stocks on the over-the-counter market. This includes such companies as bebe stores (BEBE), General Cannabis (CANN), and Fannie Mae (FNMA).

Pink Sheet stocks are stocks that trade over-the-counter that don’t qualify for OTCQX or OTCQB.

The Expert Market consists of private transactions between broker dealers and professional investors.

The Grey Market is for stocks that have been suspended from trading or can be for pre-IPO stocks.


Disclosure: Author didn’t own any of the above at the time the article was written.

The Stock market will be Closed on Labor Day and These Other Days

In case you were wondering, the New York Stock Exchange and NASDAQ will be closed on Labor Day, Monday, September 7, 2020.

These markets will also be closed these following days:

  • Thanksgiving Day, Thursday, November 26, 2020
  • Christmas Day, Friday, December 25, 2020
  • New Years Day, Friday, January 1, 2021

In addition:

The stock market will close early at 1:00 p.m. ET (1:15 p.m. for eligible options) 10:00 a.m PT on Friday, November 27, 2020.

The stock market will close early at 1:00 p.m.  ET (1:15 p.m. for eligible options) 10:00 a.m PT on Thursday, December 24, 2020.

So How Many Stocks Really Are There?

Have you ever wondered how many different stocks are available to investors? $3,000? $5,000? $10,000?

Well, here is the answer. First, according to NASDAQ, there are 3,274 stocks traded on NASDAQ. The same source says that there are 3,144 stocks traded on the New York Stock Exchange and 358 American Stock Exchange traded stocks.

Now we get to the over-the-counter companies. This includes all the various levels of OTC stocks, Pink Sheet stocks, and Grey Market stocks. There are actually 17,355 stocks in all these categories, according to OTCMarkets.com.

Add these altogether and shat you get is a total of 24,131 stocks.