Should You Buy Non-Fungible Tokens (NFTs)?

by Fred Fuld III

You may have read about all the hype over the last few months regarding non-fungible tokens, more commonly called NFTs, and occasionally referred to as nifties.

If you don’t know what an NFT is, I will try to explain it as simple as I can. An NFT is a digital asset, such as a jpg or png artwork, a gif, a cartoon, music, a video, digital sports cards, video game assets, and even naming rights to a giant sea bass. The NFT is recorded on a blockchain which secures the ownership of the asset and certifies that the asset is unique, or one of a very limited quantity.

Stock Ticker Man Spitting Out Money

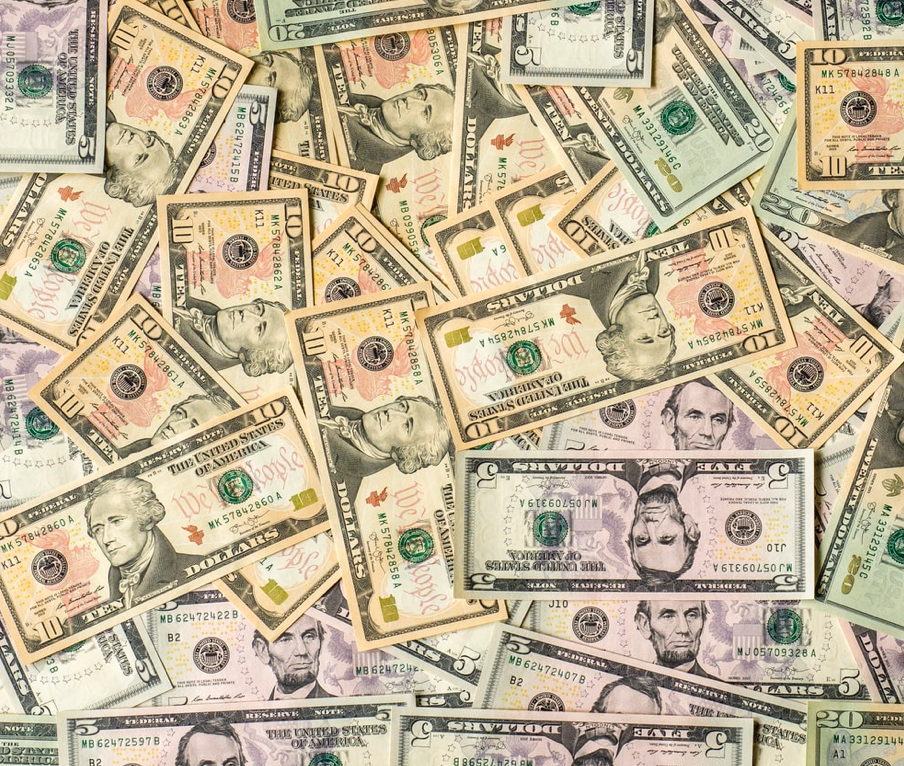
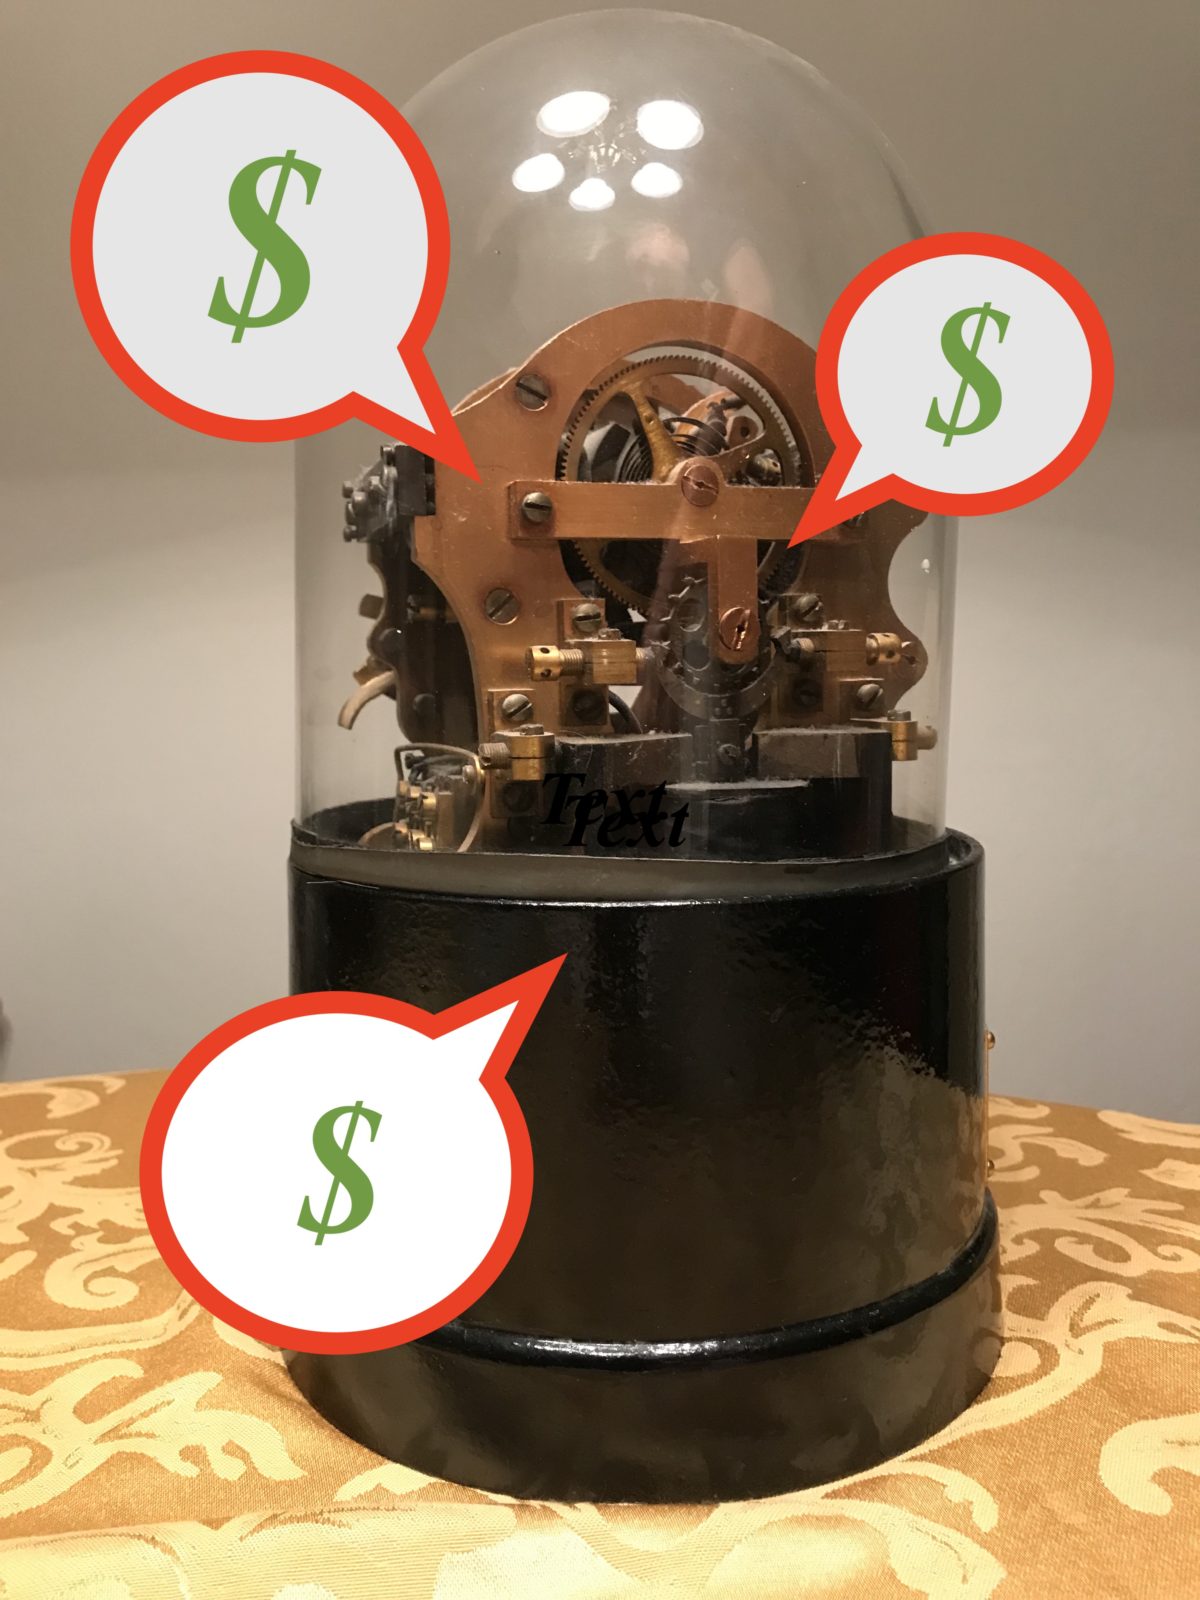
Stock Ticker Man Spitting Out Money NFT

The NFTs are usually sold on platforms such as OpenSea, Rarible, SuperRare, and Foundation, with cryptocurrency, such as Ether, being the primary currency. Some sales have facilitators for buyers who just want to pay by credit card or check.

The prices of many of these NFTs has been skyrocketing. Last year, the NFT market was about $250 million. For the first quarter of this year, sales jumped to $2 billion. You may have heard that Jack Dorsey, the CEO of Twitter (TWTR), sold an NFT of his first tweet for $2.9 million.

Michelle Phillips, vocalist with the Mamas & the Papas, songwriter, and actress has gotten in on the act. A couple months ago, I interviewed her about her NFT auction (I believe it was her only NFT auction interview) and all ten of her NFTs  sold out.

With regards to buying NFTs as an investment, I won’t comment on that because I never make investment recommendations. However, you should treat NFTs like art or collectables. If you like what you see and you plan to hold on to it without the expectation of reselling at a profit, then maybe you should buy it.

You might even want to create your own NFT. Click HERE for an example of a stock market themed NFT for sale on Rarible.


Stocks Going Ex Dividend in September 2021

The following is a short list of some of the many stocks going ex dividend during the next month.

Many traders and investors use the stock trading technique called ‘Buying Dividends,’ also commonly referred to as ‘Dividend Capture.’ This is the strategy of buying stocks before the ex dividend date and selling the stock shortly after the ex date at about the same price, yet still being entitled to the dividend.

This technique generally works in bull markets and flat or choppy markets, but you need to avoid the strategy during bear markets. In order to be entitled to the dividend, you have to buy the stock before the ex-dividend date, and you can’t sell the stock until after the ex date.

The actual dividend may not be paid for another few weeks. WallStreetNewsNetwork.com has compiled a downloadable and sortable list of the stocks going ex dividend in the near future. The list contains many dividend paying companies, lots with market caps over $500 million, and some with yields over 2%. Here are a few examples showing the stock symbol, the ex-dividend date, the periodic dividend amount.

Home Depot, Inc. (HD) 9/1/2021 1.65 2.03%
Ross Stores, Inc. (ROST) 9/3/2021 0.285 0.92%
HP Inc. (HPQ) 9/7/2021 0.194 2.75%
Kimberly-Clark Corporation (KMB) 9/9/2021 1.14 3.36%
Domino’s Pizza Inc (DPZ) 9/14/2021 0.94 0.75%
Macy’s Inc (M) 9/14/2021 0.15 0.64%
DTE Energy Company (DTE) 9/17/2021 0.825 2.74%
Portland General Electric Company (POR) 9/24/2021 0.43 3.37%
Xerox Holdings Corporation (XRX) 9/29/2021 0.25 4.38%

The additional ex-dividend stocks can be found HERE . (If you have been to the page before, and the latest link doesn’t show up, you may have to empty your cache.) If you like dividend stocks, you should check out some of the other high yield stock lists at WSTNN.com HERE .

Dividend definitions:

Declaration date: the day that the company declares that there is going to be an upcoming dividend.

Ex-dividend date: the day on which if you buy the stock, you would not be entitled to that particular dividend; or the first day on which a shareholder can sell the shares and still be entitled to the dividend.

Record date: the day when you must be on the company’s books as a shareholder to receive the dividend. The ex-dividend date is normally set for stocks at two business days before the record date.

Payment date: the day on which the dividend payment is actually made, which can be as long at two months after the ex date.

Don’t forget to reconfirm the ex-dividend date with the company before implementing this technique.

Disclosure: Author did not own any of the above at the time the article was written; affiliate links are on this page.

How many stocks are there?

by Fred Fuld III

If you have ever wondered how many stocks there are in the United States, here is your answer.

As of today, there are 25,274 different stocks traded The following is the breakdown.

NYSE 3,850
NASDAQ 3,828
AMEX 549
OTCQX 598
OTCQB 1,091
Pink Sheets 11,179
Expert Market 830
Grey Market 3,349
TOTAL 25,274

OTCQX stocks are more established large companies that trade over-the-counter. This includes such companies as adidas (ADDYY), Greyscale Bitcoin Trust (GBTC), and Heineken (HKHHY). Many foreign companies are traded in the market.

OTCQB stocks are entrepreneurial and venture capital stocks on the over-the-counter market. This includes such companies as bebe stores (BEBE), General Cannabis (CANN), and Fannie Mae (FNMA).

Pink Sheet stocks are stocks that trade over-the-counter that don’t qualify for OTCQX or OTCQB.

The Expert Market consists of private transactions between broker dealers and professional investors.

The Grey Market is for stocks that have been suspended from trading or can be for pre-IPO stocks.


Disclosure: Author didn’t own any of the above at the time the article was written.

Stocks Selling Below Cash per Share

by Fred Fuld III

It may be hard to believe that with so many stocks selling a nosebleed levels, especially the meme stocks, that there are actually stocks that not only sell below book value but also sell below cash per share. In addition, these stocks have little or no debt.

What this means is that if the company were to go out of business today, assuming the buildings, real estate, machinery, patents, and other assets were totally worthless, there would still be enough cash to distribute to all shareholders at an amount higher than the current stock price.

Here are a couple stocks that sell below cash per share, have no or almost no debt and have a price to earnings ratio of less than 20.

Digital Ally (DGLY) has a market cap of $67.5  million and trades at 2.83 times earnings. The company, which makes and markets advanced video recording products, recently reported that second quarter earnings increased by 44% over the same quarter last year.

Voyager Therapeutics (VYGR) has a market cap of $107.4 million and a P/E ratio of 6.17. It is a biotech company that focuses on the development of treatments for patients suffering from severe neurological diseases.

Just remember, the stocks are selling at a low price and have low market caps for a reason, and are speculative.


Disclosure: Author didn’t own any of the above at the time the article was written.


Stocks with the Highest Short Interest: Short Squeeze Plays

by Fred Fuld III

As I write this, the Dow Jones Industrial  Average is down 477, and the S&P is also down. Maybe while the market has dropped so much, now might be the time to look for short squeeze opportunities.

Here is a review about the short squeeze and its terminology. When you short a stock, it means that your goal is to make money from a drop in the price of a stock. Technically, what happens is that you borrow shares of a stock, sell those shares, then buy back those shares at a hopefully lower price so that those shares can be returned. This all happens electronically, so you don’t actually see all the borrowing and returning of shares; it just shows up on your screen as a negative number of shares.

Short selling can be profitable, but sometimes when the stock moves against the short sellers, and begins to rise, the short sellers jump in right away to buy shares to cover their positions, creating what is called a short squeeze. When a short squeeze takes place, it can cause the share prices to increase fast and furiously. Any good news can trigger the short squeeze.

Some traders utilize this situation by looking for stocks to buy that may have a potential short squeeze. Here is what a short squeeze trader should take into consideration:

Short Percentage of Float ~ The float is the number of freely tradable shares and the short percentage is the number of shares held short divided by the float. Amounts over 10% to 20% are considered high and potential short squeeze plays.

Short Ratio / Days to Cover / Short Interest Ratio -This is probably the most important metric when looking for short squeeze trades, no matter what you call it. This is the number of days it would take the short sellers to cover their position based on the average daily volume of shares traded. This is a significant ratio as it shows how “stuck” the short sellers are when they want to buy in their shares without driving up the price too much. Unfortunately for the shortsellers, the longer the number of days to cover, the bigger and longer the squeeze.

Short Percentage Increase ~ This is the percentage increase in in the number of short sellers from the previous month.

Check out the following list, but be aware, that often some stocks are heavily shorted for a reason. All these stocks have significant short metrics.

Stock Symbol % Float Shorted Days to Cover Stock Price
Workhorse WKHS 35% 2.2 8.97
Arcimoto FUV 34% 5.4 10.94
Blink BLNK 34% 6.2 30.09
Support.com SPRT 33% 1.5 8.31

So as an example, Arcimoto has 34% of the float shorted, and it will takeover five days for the short sellers to cover their positions, based on the average daily volume.

Obviously, there is no guarantee that these stocks will go up, but if I was short any stock, I wouldn’t want to waste any time covering my position if the stock started to move up sharply, before all the other short sellers clamor in and drive the price way up.

Disclosure: Author didn’t own any of the above at the time the article was written

The Perfect Investment: 5.45% US Government Guaranteed with No Minimum Investment

by Fred Fuld III

What would you think of an investment with the following characteristics:

1. Over 5% guaranteed return on your investment within less than a month!
2. Inflation-proof
3. Short term or long term investment: your choice
4. Guaranteed by the United States Government
5. No minimum investment
6. An easily transferable bearer investment with no registration required
7. The investment will never go down in value

The Perfect Investment

Can you guess what this investment is? It’s the Forever Stamp, the stamp issued by the US Post Office used to purchase one ounce of postage, no matter how high the price of postage rises, even if the postage rate rises to $1, $10, or even $20 per ounce.

The price of first class postage will be increasing before the end of this month on August 29 by 5.45%, from 55 cents to 58 cents. However, if you buy Forever Stamps by August 28, you can still use the stamp for one ounce of first class postage.

The price of first class postage has continued to rise historically. Back in 1968, the price of a first class stamp was only 6 cents. The price has jumped by 867% since then, which works out to 4.5% annualized.

You can still buy these stamps and take advantage of this ‘investment’. Over the long term, with inflation inevitable, postage rates will continue to increase.

So who would this purchase be useful for?

If you still pay a lot of bills using checks in the mail

If you own a small company that does a lot of mass mail-outs

If you are part of a club or organization that sends out printed monthly newsletters (there are actually a lot of these groups that still send printed newsletters)

If you mail out merchandise sold though eBay, Etsy, and other online sites without using the built-in postage service (many sellers of low priced items just use regular postage)

If you want to send out a sales-oriented flyer for your business as an alternative or in addition to an email blast, using some of the more unusual Forever Stamps to get people’s attention to open their mail

If you want to just sell your stamps down the road at a profit to either collectors or those that want to use them for any of the above reasons (there are almost a thousand listings on eBay right now for Forever Stamps, many selling close to face value)

Forever Stamps

Billion Dollar Whale: One of the Biggest Financial Swindles in History

by Fred Fuld III

If you haven’t read the book, Billion Dollar Whale: The Man Who Fooled Wall Street, Hollywood, and the World, by Tom Wright & Bradley Hope, you need to read it.

Do you know what all of the following have in common (in no particular order)?

Paris Hilton
Leonardo Dicaprio
Martin Scorsese
Malasia
Swiss Banks
Kleptocracy
Wolf of Wall Street Movie
Hollywood
Wall Street
Goldman Sachs
$500,000,000 Yacht
Miranda Kerr
$325,000 Ferrari
Supermodels
$33.5 million Manhattan condominium
President Obama
President Trump
Jamie Foxx
Busta Rhymes
Kasseem Dean
Alicia Keys
Swizz Beatz
Money Laundering
Cyprus
China
Macau
Indonesia
Bali
United States
12,000 pieces of jewelry
567 handbags
423 watches
FBI
Casinos
Million dollar parties
Las Vegas

All of the above are connected to a man named Jho Low, a Malaysian businessman who is accused of swindling billions of dollars, indirectly from the Malaysian government, and spending it on huge parties with actors, models, numerous bottles of champagne, gambling, and entertainment, in addition to expensive homes around the world.

Ironically, according to the book, Low funded the Martin Scorsese movie The Wolf of Wall Street, starring Leonardo DiCaprio, which was based on the true story of Jordan Belfort, the convicted stock market manipulator and boiler-room operator.

The story of Low reads like a financial mystery and thriller, and I rarely say this about a non-fiction book, but it is a page-turner.

So if you are looking for some end of summer reading, and if you like to read about frauds, scams, and swindles,  Billion Dollar Whale will definitely keep you occupied.


Affiliate links on this page.

Should You Be investing in the Olympics?

by Fred Fuld III

The 2020 Olympic Games began on Friday, July 23, in 2021 of course. If you haven’t been watching the Olympics, you are missing the greatest sports event of the year.

The Olympic Games have many sponsors and several of these worldwide Olympic Partners are publicly traded.

Some investors believe that the sponsoring of this event will help increase revenues for the company sponsors. Others believe that if these companies are putting up all this money, that they expect a return on their investment.

So if you have wondered if investing in these companies would provide a good return, then check out the results below.

Olympics Stock Index

Company Symbol Price 7/23/21 Price 8/4/21 Gain/Loss
Airbnb ABNB 138.73 147.4 6.25%
Alibaba BABA 206.53 200.71 -2.82%
Bridgestone BRDCY 21.88 21.93 0.23%
Coca-Cola KO 57.01 56.1 -1.60%
Dow Chemical DOW 60.11 60.99 1.46%
General Electric GE 101.68 102.91 1.21%
Intel INTC 53 53.9 1.70%
Panasonic PCRFY 12.21 12.19 -0.16%
Procter & Gamble PG 139.79 142.43 1.89%
Toyota TM 179.85 182.18 1.30%
VISA V 249.02 236.67 -4.96%
TOTAL 1219.81 1217.41 -0.20%
EQUAL WEIGHT RETURN -7.96%

You will notice that the worst performers to date are VISA (V) and Alibaba (BABA) and the best are Airbnb (ABNB) and Procter & Gamble (PG).

Based on an equal weighting of all the companies, the total return from the start of the Olympics on July 23 to today, August 4, is a negative 7.96%, far worse than the market as a whole. The S&P 500 was only down 0.21% during that same time frame.

Yet there is still more time for the Olympics Stock Index to recover as the events don’t end until August 8.


Disclosure: Author owns TM.

Robinhood Investors Getting Rich

by Fred Fuld III

Last Thursday, Robinhood (HOOD) went public at an IPO price of $38 per share. The stock sold off a little that first day, but today, the stock reached a price per share of $85 shortly after the stock market opened.

This works out to a 123% gain in one week. Not too shabby for a recent IPO.

Even if you had waited until yesterday to buy the stock on the close at $48.50, the gain would be 75%.

Robinhood has almost turned into a meme stock, not due to a short squeeze but do to the popularity of the stock, as it has garnered much attention on Reddit.

Options started trading on the stock today, and the volume and activity is huge. The strike prices range from 20 to 95 for all expirations from August to January of next year. Will higher strikes need to be added? Who knows? Maybe even lower strikes.

The August implied volatility is over 200% and September is in excess of 170%.

It will be interesting to see if Robinhood turns into another GameStop (GME) or AMC (AMC), or if it takes you for a RIDE.


Disclosure: Author owns two shares of HOOD.