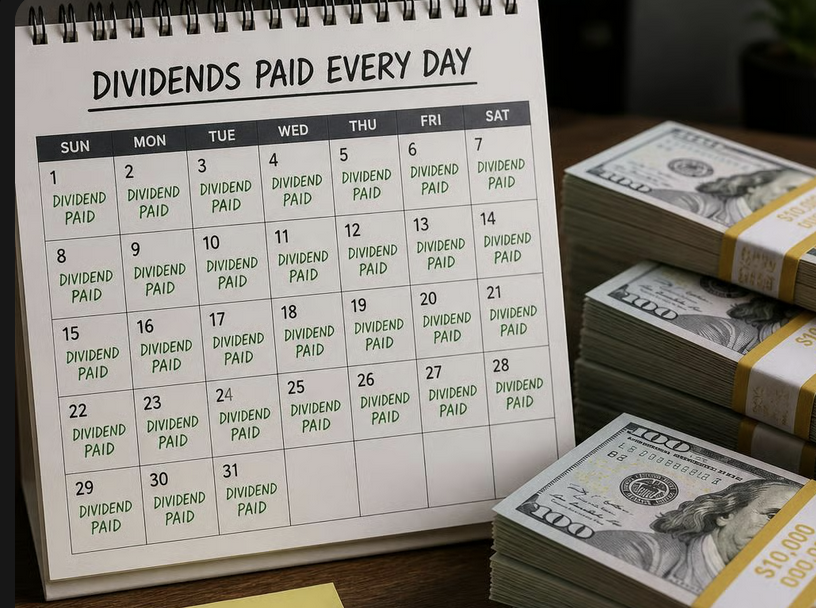
Are Space Technology Stocks Going to the Moon?

by Fred Fuld III

The space technology sector, once the exclusive playground of national governments and defense giants, has evolved into a dynamic commercial frontier. Often referred to as “NewSpace,” this industry is currently transitioning from a period of speculative growth to one defined by operational execution and revenue generation. The following article examines the current state of the space economy and profiles three distinct players within the ecosystem.

The New High Ground: The State of the Space Economy

The global space industry is projected to reach $1.8 trillion by 2035, driven by a drastic reduction in launch costs and a surge in demand for satellite-enabled data. While the initial wave of investment focused on launch capabilities, the “second wave” is centered on utility: what we can do once we are in orbit or on the lunar surface.

Key trends shaping the industry include:

  • The Proliferation of SmallSats: Miniaturized satellites are being deployed in large constellations to provide global internet and persistent Earth observation.
  • Lunar Logistics: With the Artemis program and international interest in the Moon, a private “lunar economy” is emerging to provide transport, power, and communications on the lunar surface.
  • Software-Defined Space: Increasingly, the value of space assets lies in the data analytics and software layers rather than just the hardware.

Company Profiles and Financial Performance

1. Intuitive Machines (LUNR)

Intuitive Machines is a diversified space company focused on space exploration, particularly lunar infrastructure. They gained significant international attention in early 2024 by becoming the first private company to successfully land a spacecraft (Odysseus) on the Moon.

  • Operational Focus: The company operates through four business units: Lunar Access, Orbital Services, Spatial Data Infrastructure, and Space Products/Infrastructure.
  • Financial Snapshot: * Revenue Growth: For the full year 2023, the company reported revenue of $79.5 million. However, following the success of the IM-1 mission and new contract wins, 2024 revenue guidance has significantly increased, with the company aiming for $210 million to $230 million.
    • Backlog: As of early 2024, the company maintained a robust contracted backlog of approximately $268.2 million, largely driven by NASA’s Commercial Lunar Payload Services (CLPS) program.
    • Market Position: LUNR is positioned as a high-stakes “infrastructure” play for the burgeoning lunar economy.

2. Planet Labs (PL)

Planet Labs operates the world’s largest fleet of Earth-imaging satellites. Their “Doves” capture a complete image of the Earth’s entire landmass every day, creating a searchable history of planetary change.

  • Operational Focus: Planet sells data subscriptions to a wide range of customers, including agricultural firms, government intelligence agencies, and environmental researchers. Their primary value proposition is “persistent monitoring.”
  • Financial Snapshot: * Fiscal Year 2024 Results: Planet reported annual revenue of $220.7 million, representing a 15% year-over-year increase.
    • Gross Margin: The company maintains a strong non-GAAP gross margin of approximately 52-54%, reflecting the scalable nature of their data-as-a-service model.
    • Path to Profitability: While not yet GAAP profitable, the company has emphasized a shift toward Adjusted EBITDA break-even by late fiscal year 2025 by optimizing operating expenses.

3. Firefly Aerospace (FLY)

Since going public in late 2025, Firefly has positioned itself as a “full-service” space company, spanning launch (Alpha), orbital vehicles (Elytra), and lunar landers (Blue Ghost).

  • Recent Developments: In April 2026, Firefly announced a major collaboration with NVIDIA to integrate Jetson AI modules into its Elytra spacecraft. This allows for “Ocula,” a real-time lunar imaging service that processes data in orbit rather than waiting for slow downlinks to Earth.
  • Financial Performance (FY 2025/Q1 2026):
    • Revenue: 2025 revenue surged 163% year-over-year to $159.9 million.
    • Backlog: The company holds a massive $1.4 billion backlog, providing significant multi-year visibility.
    • Earnings: While still in a high-growth reinvestment phase (reporting a net loss), Q4 2025 EPS of -$0.26 beat analyst expectations as launch frequency improved.

Industry Outlook

The space technology sector remains sensitive to interest rates and capital expenditure cycles. However, for companies like Planet Labs and Intuitive Machines, the focus has shifted from “can we get there?” to “can we monetize the data?” For investors and observers, the key metrics to watch over the coming year will be contract backlog conversion, gross margin expansion in data services, and the frequency of successful launch cadences.

Disclosure: Author didn’t own any of the above at the time the article was written. No recommendations are expressed or implied.

Stocks Going Ex Dividend in April of 2026

The following is a short list of some of the many stocks going ex-dividend during the next month, which can be helpful for traders and investors interested in the stock trading technique known as “Buying Dividends” or “Dividend Capture.” This strategy involves purchasing stocks before the ex dividend date and selling them shortly after the ex-date at a similar price, while still being eligible to receive the dividend payment.

Although this dividend capture strategy generally proves effective in bull markets and flat or choppy markets, it is advisable to exercise caution and consider avoiding this strategy during bear markets. To qualify for the dividend, it is necessary to buy the stock before the ex-dividend date and refrain from selling it until on or after the ex-date.

However, it is important to note that the actual dividend may not be paid for several weeks, as the payment date may not be until two months after the ex-dividend date.

For investors seeking a comprehensive list of stocks going ex-dividend in the near future, WallStreetNewsNetwork.com has compiled a downloadable list containing numerous dividend-paying companies. Here are a few examples showcasing the stock symbol, ex-dividend date, periodic dividend amount, and annual yield.

Comcast Corporation Class A (CMCSA)4/1/20260.334.66%
Cisco Systems, Inc. (CSCO)4/2/20260.422.10%
GE HealthCare Technologies Inc. (GEHC)4/2/20260.0350.20%
Intuit Inc. (INTU)4/9/20261.201.11%
Phillips Edison & Company, Inc. (PECO)4/15/20260.10833.53%
Horizon Technology Finance Corporation (HRZN)4/16/20260.0628.47%
Scholastic Corporation (SCHL)4/30/20260.202.07%

To access the entire list of over 100 ex-dividend stocks, subscribers will receive an email in the next couple days with the full list. If you are not already a subscriber, you can sign up using the provided signup box below. Don’t miss out on this valuable information, and the best part is that it’s free!

Dividend Definitions

To better understand the dividend-related terms, let’s define them:

Declaration date: This refers to the day when a company announces its intention to distribute a dividend in the future.
Ex-dividend date: On this day, if you purchase the stock, you would not be eligible to receive the upcoming dividend. It is also the first day on which a shareholder can sell their shares and still receive the dividend.
Record date: This marks the day when you must be recorded on the company’s books as a shareholder to qualify for the dividend. Typically, the ex-dividend date is set two business days prior to the record date.
Payment date: This is the day on which the dividend payment is actually made to the eligible shareholders. It’s important to note that the payment date can be as long as two months after the ex-date.

Before implementing the “Buying Dividends” technique, it is crucial to reconfirm the ex-dividend date with the respective company to ensure accuracy and avoid any unexpected changes.

In conclusion, being aware of the stocks going ex-dividend can be advantageous for traders and investors employing the “Buying Dividends” strategy. WallStreetNewsNetwork.com provides a convenient resource to access a comprehensive list of such stocks, allowing individuals to plan their investment decisions effectively. Remember to stay informed and consider market conditions before employing any investment strategy.

Disclosure: Author may have positions in some of the above at the time the article was written. No investment recommendations are expressed or implied

Are Oil Shipping Companies Bullish or Bearish?

by Fred Fuld III

The escalating conflict in the Middle East, particularly the military strikes involving the U.S., Israel, and Iran in early 2026, has sent shockwaves through the global energy and maritime sectors. With the Strait of Hormuz—a chokepoint for 20% of global oil—experiencing a 95% drop in traffic, the “oil-shipping nexus” is undergoing its most significant disruption since the 1970s.

The Geopolitical Squeeze: Oil and Freight Rates

Since the conflict escalated on February 28, 2026, Brent Crude surged past $100 per barrel, briefly peaking near $120in mid-March. This spike is a direct result of Iranian strikes on energy infrastructure and the subsequent maritime blockade in the Persian Gulf.

For shipping companies, the situation is a double-edged sword:

  • The Bull Case: Rerouting vessels around the Cape of Good Hope has increased “ton-mile” demand. Suezmax tanker rates have reportedly hit staggering peaks of $400,000 to $500,000 per day as available capacity shrivels.
  • The Bear Case: Rising bunker fuel costs (the single largest expense for carriers) and “risk-off” sentiment in the broader stock market have tempered gains. Investors are weighing massive spot-rate windfalls against the threat of a global recession.

Marine Shipping Stock Profiles

While the sector is volatile, certain companies are positioned to navigate—or even profit from—this turbulence. Below are the profiles and financial standings of four key players as of late March 2026.

1. Costamare Inc. (CMRE)

Costamare is a leading owner of containerships and dry bulk vessels. Unlike pure tanker plays, Costamare relies on long-term charters, providing a “buffer” against immediate spot market volatility.

  • Profile: Headquartered in Monaco, it operates a fleet of 68 containerships and over 40 dry bulk vessels.
  • Financial Snapshot (TTM):
    • Stock Price: ~$16.79 (Down 2% in the last month; up 121% over 1 year).
    • Market Cap: $2.02 Billion.
    • Revenue: $1.09 Billion.
    • Net Income Margin: 33.3%.
    • Dividend Yield: 2.74%.
  • Current Outlook: Analysts maintain a Hold rating. While its revenue backlog is a solid $2.4 billion, a weaker dry bulk market has offset some of the gains seen in its container segment.

2. Danaos Corporation (DAC)

Danaos is one of the world’s largest independent owners of modern, large-size containerships, primarily chartering to giants like Maersk and MSC.

  • Profile: Based in Greece, Danaos focuses on high-efficiency vessels and has a significant presence in the trans-Pacific and Asia-Europe lanes.
  • Financial Snapshot (TTM):
    • Stock Price: ~$111.44 (Up 155% over 5 years).
    • Market Cap: $2.03 Billion.
    • P/E Ratio: 4.17 (Indicates the stock may be undervalued).
    • Net Margin: 47.4%.
    • Dividend: $3.50 (Yielding ~3.1%).
  • Current Outlook: Rated as a Buy by several analysts. Its massive cash reserves ($1.04B) and low debt-to-equity ratio (30.4%) make it a favorite for “flight-to-quality” investors during regional instability.

3. Hafnia Limited (HAFN)

Hafnia is a top-tier operator of product tankers, transporting refined oil, chemicals, and gas. It is the company most directly impacted by the Hormuz crisis.

  • Profile: Operates a fleet of approximately 200 vessels. It provides a fully integrated platform, including technical and pool management.
  • Financial Snapshot (TTM):
    • Stock Price: ~$7.00 (Reached an all-time high of $7.68 in early March).
    • Market Cap: $3.60 Billion.
    • P/E Ratio: 10.57.
    • Quarterly Dividend: $0.176 (Variable based on payout policy).
  • Current Outlook: Hafnia is currently in a “Paradox Zone.” While spot rates are at historic highs, the stock has seen “risk-off” selling as investors fear a prolonged blockade could eventually stifle total trade volume.

4. Matson, Inc. (MATX)

Matson is a specialized ocean carrier primarily serving Hawaii, Alaska, and Guam, with a high-speed service from China to Long Beach.

  • Profile: Unlike the others, Matson is a U.S.-based Jones Act carrier. This insulates it from some international legal risks but makes it sensitive to U.S. domestic fuel prices.
  • Financial Snapshot (TTM):
    • Stock Price: ~$163.16 (Near its 52-week high of $177.51).
    • Market Cap: $3.83 Billion.
    • EPS (2026 Est.): $13.33.
    • P/E Ratio: 12.00.
  • Current Outlook: Matson has a Strong Buy consensus. Its “China Expedited” service is becoming more valuable as traditional shipping lanes through the Middle East face delays, allowing Matson to command premium pricing.

Just remember, the price of oil can turn on a dime. Anything can happen in the Middle East, good or bad.

Disclosure: Author didn’t own any of the above at the time the article was written. No investment recommendations are expressed or implied.

Powering Profits: Why Falling Oil Prices Could Boost Hawaiian Electric and ConEd

by Fred Fuld III

The relationship between geopolitical stability and utility stock performance might seem abstract, but for companies heavily dependent on fossil fuels, it is anything but. The current conflict in the Middle East has injected significant volatility into global oil markets, driving up the cost of crude.

However, for forward-looking investors, the focus is already shifting to the aftermath. When the war wraps up and the geopolitical risk premium evaporates, oil prices are likely to retreat from their current highs. This scenario creates a powerful tailwind for a specific subset of the utility sector, most notably Hawaiian Electric Industries (NYSE: HE)and Consolidated Edison (NYSE: ED), ultimately providing a boost to their stock prices.

To understand why, we must examine how these two distinct utilities utilize oil and why lower prices are a significant operational benefit.


The Unique Case of Hawaiian Electric: Ground Zero for Oil Sensitivity

Hawaiian Electric Industries (HE) is perhaps the most oil-sensitive publicly traded utility in the United States. Due to Hawaii’s geographical isolation, the islands have historically been unable to access the mainland’s vast interstate natural gas pipelines or large-scale hydroelectric resources.

Consequently, HE has relied on imported petroleum—primarily fuel oil—for the vast majority of its electricity generation. This dependency means that HE’s operational costs are directly coupled to the global price of crude oil.

The Benefit of Falling Prices:

When oil prices drop, HE receives an immediate and substantial benefit:

  1. Lower Generation Costs: The primary advantage is a dramatic reduction in the cost of producing electricity. As fuel is the largest variable expense for an oil-fired plant, cheaper crude directly lowers the bottom line cost of generation.
  2. Increased Affordability and Demand Stability: Hawaii already has some of the highest electricity rates in the nation. When oil prices are high, these costs are passed on to consumers via fuel adjustment clauses, straining household and business budgets. Lower oil prices allow HE to reduce these adjustments, making electricity more affordable and stabilizing demand, particularly in crucial sectors like tourism.+1
  3. Improved Cash Flow for Transition: While HE is actively transitioning to renewable energy (with a 100% renewable mandate by 2045), maintaining its existing oil infrastructure is expensive. Lower oil prices improve the company’s free cash flow in the near term, providing more capital to invest in the solar, wind, and storage projects necessary to meet its long-term goals.

The Bottom Line for HE Stock: For investors, a sustainable drop in oil prices transforms HE from a utility struggling with high input costs into one with expanding margins and improved financial flexibility. This shift in sentiment is typically reflected in a higher stock valuation.


Consolidated Edison: Dual-Fuel Capabilities as a Strategic Advantage

Consolidated Edison (ConEd), serving New York City and Westchester County, has a very different profile than Hawaiian Electric. It is a massive urban utility that primarily relies on natural gas, nuclear power, and increasingly, renewables. However, ConEd has a strategic asset that makes it sensitive to oil prices: its dual-fuel capability.

ConEd maintains several large “peaker” plants that can generate electricity using either natural gas or fuel oil. These plants are called into action only during periods of extreme electricity demand (such as heat waves or severe cold snaps) or when natural gas supplies are constrained.

The Benefit of Falling Prices:

A drop in oil prices benefits ConEd primarily through enhanced operational flexibility and cost optimization:

  1. Economic Fuel Switching: When oil prices fall relative to natural gas, ConEd can strategically switch its dual-fuel plants to run on cheaper oil. This allows the utility to choose the most cost-effective fuel source, optimizing its dispatch stack and lowering its overall cost of energy production during peak periods.
  2. Mitigating Gas Price Volatility: Natural gas prices can be highly volatile, especially in the winter when demand for home heating competes with electricity generation. Cheap oil provides an economic “ceiling” for fuel costs. If natural gas prices spike, ConEd has the secure, lower-cost alternative of fuel oil readily available.
  3. Enhanced Reliability at Lower Cost: The ability to use oil ensures that ConEd can meet critical peak demand without being forced to purchase natural gas at exorbitant spot market prices. This enhances the reliability of the grid in New York City while keeping costs manageable, a factor that is looked upon favorably by regulators and investors alike.

The Bottom Line for ED Stock: While oil is a smaller percentage of ConEd’s total energy mix, the strategic use of dual-fuel plants makes cheap oil a distinct advantage. Lower oil prices improve operational efficiency and protect the company from extreme natural gas price spikes, making ED’s earnings more predictable and attractive to defensive investors.


The Market View: A Catalyst for Revaluation

The utility sector is traditionally seen as a “safe haven” for investors seeking stable income and low volatility. However, when specific utilities like Hawaiian Electric and ConEd face high, volatile input costs like oil, that safe-haven status can be compromised.

A post-war environment characterized by falling oil prices acts as a significant catalyst for these companies. It directly improves their near-term financial performance, reduces operational risk, and allows management to focus capital on long-term growth and transition strategies rather than high fuel bills.

For investors who anticipate the cessation of Middle East conflict, positioning in HE and ED stocks now provides an opportunity to capture the upside of a widely anticipated economic normalization: the return of cheap, stable oil prices.


Disclaimer: This article is for informational purposes only and does not constitute financial advice. Author didn’t own any of the above at the time the article was written.

Will AI Create an Overall Job Loss: NO!

by Fred Fuld III

The “Net Gain” Argument: Historical Precedent

Historically, every major technological leap—from the steam engine to the internet—was met with “automation anxiety.” However, these technologies consistently created more jobs than they destroyed by lowering the cost of goods and services, which increased consumer demand.

Technology doesn’t just destroy jobs; it creates entirely new categories of work that were previously unimaginable (e.g., social media managers, cloud architects). 

The World Economic Forum (WEF) Future of Jobs Report 2025 projects that while 92 million jobs may be displaced by 2030, 170 million new roles will be created. This results in a net gain of 78 million jobs globally. (Source: World Economic Forum, “Future of Jobs Report 2025.”)

Augmentation vs. Replacement

A critical distinction is that AI is automating tasks, not jobs. Most jobs consist of a “bundle” of tasks; AI handles the routine ones, allowing humans to focus on high-value, complex work.

AI acts as a “co-pilot,” making workers more productive. When workers are more productive, their labor becomes more valuable, often leading to higher wages and more hiring to handle the increased output.

PwC 2025 Global AI Jobs Barometer found that industries most exposed to AI are seeing 3x higher growth in revenue per worker. (Source: PwC, “2025 Global AI Jobs Barometer.”)

The “Productivity Paradox” and Economic Growth

Higher productivity through AI leads to lower prices for consumers. This “saved” money doesn’t disappear; it is spent elsewhere in the economy, creating demand for jobs in sectors like healthcare, leisure, and personal services.

AI-driven efficiency boosts Global GDP, which inherently expands the labor market.

Goldman Sachs estimates that AI could eventually increase the total annual value of goods and services produced globally by 7% (roughly $7 trillion) and boost productivity growth by 1.5 percentage points over a 10-year period. (Source: Goldman Sachs Research, “The Potentially Large Effects of Artificial Intelligence on Economic Growth.”)

Addressing the “Labor Shortage”

In many developed nations, the bigger threat is not a lack of jobs, but a lack of workers due to aging populations. AI is a necessary tool to maintain economic output as the human workforce shrinks.

AI isn’t “taking” jobs; it’s filling the gap left by a global talent shortage and declining birth rates. 

According to the Korn Ferry Institute, by 2030, there will be a global human talent shortage of more than 85 million people. AI is the only way to prevent economic stagnation. (Source: Korn Ferry, “The Talent Crunch.”)

The Resilience of the Labor Market

Since ChatGPT was released in November 2022, the U.S. economy hasn’t seen a wave of mass unemployment. In fact, the labor market remained historically tight through 2024 and 2025.

  • Job Gains: While some tech firms saw layoffs, these were often corrections from pandemic-era over-hiring rather than “AI replacements.” Broadly, sectors like healthcare, construction, and hospitality continued to add hundreds of thousands of jobs monthly.
  • The Unemployment Rate: In the years following the “GenAI explosion,” the U.S. unemployment rate hovered near 50-year lows (between 3.4% and 4.0%). If AI were truly a “job killer,” we would have seen a structural climb in these numbers.

The “Income Effect” and New Demand

When AI makes a company more efficient, that company becomes more profitable. Those profits are usually reinvested in one of three ways, all of which create jobs:

  1. Expansion: The company opens new branches or develops new products, requiring more staff.
  2. Lower Prices: Efficiency allows for cheaper products, leaving consumers with more disposable income to spend on other sectors (gyms, travel, entertainment), which creates jobs there.
  3. New Roles: Companies now need “AI Prompt Engineers,” “AI Ethics Officers,” and “Data Curators”—roles that didn’t exist in 2021.

Structural Adjustment vs. Mass Unemployment

The “adjustment” mentioned refers to the shift in skills. We are seeing a “hollowing out” of routine tasks, but a surge in demand for people who can manage the AI.

  • Complementarity: For a lawyer, AI doesn’t replace the lawyer; it replaces the 10 hours they spent summarizing documents. This allows the lawyer to take on more clients or focus on high-level strategy.
  • The Jevons Paradox: As a resource (in this case, data processing or content creation) becomes more efficient, the demand for that resource actually increases because it is now cheaper and more accessible.

Key Data

Even with AI integration, the BLS continues to project job growth in most professional categories through 2032.

If AI were a net job destroyer, we would see a rising unemployment rate alongside rising AI adoption. Instead, we see the opposite: businesses are using AI to bridge the gap in a labor-starved economy. We aren’t losing ‘jobs’; we are losing ‘drudgery,’ and humans are moving toward more creative, interpersonal, and strategic work.

Total US Nonfarm Employment (2022–2026)

PeriodTotal Employed (Millions)Context
Nov 2022154.16MChatGPT Released
May 2023155.61MRapid AI integration starts
Dec 2023156.93MOne year post-GenAI boom
May 2024158.01MTech “efficiency” layoffs peak
Jan 2025158.27MLabor market remains resilient
Jan 2026158.63MSustained growth in services/care

Source: Data compiled from U.S. Bureau of Labor Statistics (BLS) and FRED Economic Data.

As you can see from the table above, we have had three years of the most rapid AI adoption in history, yet we have 4 million more people working today than when ChatGPT was released.

The Skill-Biased Technological Change (SBTC)

AI is not deleting jobs; it is changing the composition of skills required for those jobs. While routine tasks (data entry, basic coding) are automated, the demand for “human-plus” skills—strategic oversight, emotional intelligence, and complex problem-solving—is increasing.

The Yale Budget Lab (2025) found that the “occupational mix” is shifting only slightly faster than it did during the 1990s internet boom. This is a standard evolutionary process, not a sudden collapse.

The Jevons Paradox in Action

Named after economist William Stanley Jevons, this paradox suggests that as a resource becomes more efficient to use, the total consumption of that resource actually increases.

The Software Engineering and Code Generation sector is a perfect example. This is particularly relevant because it is the industry most “threatened” by AI today, yet it perfectly illustrates how efficiency creates more work, not less.

Before Generative AI, writing a complex piece of software was expensive and slow. A company might have a backlog of 100 features they wanted to build but could only afford to hire enough developers to build 10.

AI coding assistants (like GitHub Copilot or Devin) make writing standard code 50% faster. An opponent would argue: “Now you only need half as many programmers!”

The Paradoxical Reality:

  • Lower Costs = Higher Demand: Because it is now 50% cheaper and faster to build software, the “cost of entry” for new projects drops. Companies that previously couldn’t afford custom software now commission it.
  • Expanding Scope: The company with 100 features in its backlog doesn’t fire its staff; it finally greenlights all 100 features because they are now economically viable.
  • The Complexity Ceiling: As code becomes easier to generate, systems become more complex. We don’t need fewer people; we need more people to architect, secure, and integrate the massive influx of new code.

Since the release of ChatGPT in 2022, we haven’t seen the ‘job apocalypse’ predicted by alarmists. Instead, we have seen 4 million more Americans enter the workforce. We are not seeing the disappearance of work; we are seeing the evolutionof work.

AI is doing to the ‘mental cubicle’ what the steam engine did to the field. It is liberating us from the rote, the repetitive, and the mundane. By automating the ‘how,’ AI allows humans to focus on the ‘why’—the strategy, the empathy, and the creativity that no silicon chip can replicate.

The ‘Lump of Labor’ fallacy—the idea that there is a fixed amount of work—has been proven wrong in every century of human history. As long as humans have dreams, we will have work. We aren’t heading toward a future of unemployment; we are heading toward a future of unprecedented productivity and new industries that we are only just beginning to imagine.

Don’t bet against human ingenuity. Plan for a future where technology doesn’t replace us, but empowers us to do more than ever before.

Stocks Going Ex Dividend in March of 2026

The following is a short list of some of the many stocks going ex-dividend during the next month, which can be helpful for traders and investors interested in the stock trading technique known as “Buying Dividends” or “Dividend Capture.” This strategy involves purchasing stocks before the ex dividend date and selling them shortly after the ex-date at a similar price, while still being eligible to receive the dividend payment.

Although this dividend capture strategy generally proves effective in bull markets and flat or choppy markets, it is advisable to exercise caution and consider avoiding this strategy during bear markets. To qualify for the dividend, it is necessary to buy the stock before the ex-dividend date and refrain from selling it until on or after the ex-date.

However, it is important to note that the actual dividend may not be paid for several weeks, as the payment date may not be until two months after the ex-dividend date.

For investors seeking a comprehensive list of stocks going ex-dividend in the near future, WallStreetNewsNetwork.com has compiled a downloadable list containing numerous dividend-paying companies. Here are a few examples showcasing the stock symbol, ex-dividend date, periodic dividend amount, and annual yield.

Wendy’s Company (WEN)3/2/20260.147.48%
PayPal Holdings, Inc. (PYPL)3/4/20260.141.23%
PepsiCo, Inc. (PEP)3/6/20261.42253.40%
Domino’s Pizza Inc (DPZ)3/13/20261.991.97%
Phillips Edison & Company, Inc. (PECO)3/16/20260.10833.30%
Walmart Inc. (WMT)3/20/20260.24750.80%
Keurig Dr Pepper Inc. (KDP)3/27/20260.233.03%

To access the entire list of over 100 ex-dividend stocks, subscribers will receive an email in the next couple days with the full list. If you are not already a subscriber, you can sign up using the provided signup box below. Don’t miss out on this valuable information, and the best part is that it’s free!

Dividend Definitions

To better understand the dividend-related terms, let’s define them:

Declaration date: This refers to the day when a company announces its intention to distribute a dividend in the future.
Ex-dividend date: On this day, if you purchase the stock, you would not be eligible to receive the upcoming dividend. It is also the first day on which a shareholder can sell their shares and still receive the dividend.
Record date: This marks the day when you must be recorded on the company’s books as a shareholder to qualify for the dividend. Typically, the ex-dividend date is set two business days prior to the record date.
Payment date: This is the day on which the dividend payment is actually made to the eligible shareholders. It’s important to note that the payment date can be as long as two months after the ex-date.

Before implementing the “Buying Dividends” technique, it is crucial to reconfirm the ex-dividend date with the respective company to ensure accuracy and avoid any unexpected changes.

In conclusion, being aware of the stocks going ex-dividend can be advantageous for traders and investors employing the “Buying Dividends” strategy. WallStreetNewsNetwork.com provides a convenient resource to access a comprehensive list of such stocks, allowing individuals to plan their investment decisions effectively. Remember to stay informed and consider market conditions before employing any investment strategy.

Disclosure: Author may have positions in some of the above at the time the article was written. No investment recommendations are expressed or implied.

The “Cash-Rich” Bargain: Trading Below Cash per Share

by Fred Fuld III

In the world of value investing, few metrics signal a potential “steal” more than a stock trading below its cash per share. This scenario suggests that if a company were to shut its doors today, pay off all its obligations, and distribute the remaining cash, you would potentially walk away with more money than you paid for the stock. Essentially, the market is valuing the actual business operations at less than zero.

Why Investors Hunt for “Negative Enterprise Value”

When a stock’s price is lower than its net cash (cash minus total debt) per share, it provides a unique margin of safety.

  • Liquidation Value: The company is theoretically worth more dead than alive.
  • Acquisition Magnet: These companies are prime targets for buyouts, as an acquirer could use the company’s own cash to help fund the purchase.
  • Buyback Potential: Management can use that excess cash to buy back shares, drastically increasing the ownership stake of remaining shareholders.

The Red Flags: Why the “Bargain” Might Be a Trap

If it sounds too good to be true, sometimes it is. A stock trading below its cash value is often a signal of extreme market pessimism. You must watch out for:

  1. High Debt Loads: If a company has $10 in cash per share but $15 in debt, it isn’t “cheap”—it’s underwater. Always look at Net Cash (Cash – Total Debt).
  2. Cash Burn: In industries like biotech or tech, a company might have a mountain of cash today but be losing so much money monthly that the cash will be gone in a year.
  3. Governance Issues: Sometimes cash is “trapped” in foreign subsidiaries or controlled by management that refuses to return it to shareholders.

Profile of Potential Value Stocks

While some companies often have high cash balances, it is vital to distinguish between Gross Cash and Net Cash (after debt).

Harley-Davidson (HOG)

Harley-Davidson often appears in value screens due to its massive financing arm (HDFS), which holds significant cash but also carries substantial debt.

  • Market Status (Feb 2026): Trading around $20.14.
  • The Profile: HOG is currently viewed as a deep-value play, trading at a P/E of roughly 4.7x, significantly below its peers.
  • Watch Out For: The company faces declining motorcycle shipments (down ~17-22% recently). Its cash is often tied to its financial services wing, meaning the “cash per share” can be misleading if you don’t account for the debt used to fund those motorcycle loans.

Interactive Brokers (IBKR)

As a brokerage, IBKR’s balance sheet is unique. It holds vast amounts of client cash, which can inflate “cash per share” metrics.

  • Market Status (Feb 2026): Trading around $74.90.
  • The Profile: IBKR has seen a massive run-up (up 30% in the last year). It holds over $105B in cash and short-term investments, but its debt-to-equity ratio sits at about 121%.
  • Watch Out For: Valuation. While cash-rich, many analysts consider it overvalued at current prices because the market is already pricing in high interest-income margins.

TriNet Group (TNET)

TriNet provides HR solutions and often carries a “light” balance sheet with significant cash flow.

  • Market Status (Feb 2026): Trading around $42.00 after a recent 28% plunge.
  • The Profile: Following a lowered 2026 outlook, the stock is currently in the “doghouse.”
  • Watch Out For: Rising healthcare costs are eating into their margins. While they have a history of aggressive buybacks, the current net loss in Q4 2025 suggests the cash pile might be needed for operations rather than being “excess.”

WEX Inc. (WEX)

WEX operates in the financial technology space, focusing on fleet and corporate payments.

  • Market Status (Feb 2026): Trading around $157.00.
  • The Profile: Analysts suggest the stock is significantly undervalued based on future cash flow models (some estimates as high as $400/share).
  • Watch Out For: High Leverage. WEX has a debt-to-equity ratio of 4.49, which is much higher than the industry average. This is a classic example of where “cash per share” can be a trap if you ignore the massive debt obligations.

Keep in mind that cash may not always be king.

Disclosure: Author owns HOG.

Green Bay Packers Stock Certificate to be Auctioned: Estimate $100,000

by Fred Fuld III

A few months ago, I wrote an article about investing in antique stock certificates, mentioning some that have been signed by Wells & Fargo, J.P. Morgan, and Harry Houdini.

Now sports fans, and fans of stock market and investment related collectables have the chance to acquire an extremely rare item, a Green Bay Packers stock certificate from 1923.

The certificate was issued for 20 shares by the Green Bay Football Club, from Green Bay, Wisconsin.

This extremely rare historical document will be auctioned off by Heritage Auctions in their 2026 February 28 – March 1 Winter Platinum Night Sports Catalog Auction. Pre-bidding is already taking place.

At the time this article is being written, the current bid price is $40,000, and with the buyer’s premium, $48,800.

The certificate is estimated to hammer at $100,000 or more.

Now is your chance to bid!!!

Photo courtesy of Heritage Auctions.

Can You Predict the Future of Predictive Markets?

by Fred Fuld III

In 2026, the world of prediction markets has moved from the fringes of the internet to the center of global finance.These platforms are essentially information exchanges where users buy and sell contracts on the likelihood of real-world outcomes. If you think a candidate will win an election or a tech giant will hit its earnings target, you buy a “Yes” contract. If the event happens, the contract pays out; if it doesn’t, it expires worthless.

The beauty of these markets is their accuracy. Because participants have “skin in the game,” the price of a contract serves as a real-time, crowd-sourced probability that often outperforms traditional polling and expert analysis.

Here is a breakdown of the primary prediction market platforms available today.


1. Kalshi

The Regulated Heavyweight Kalshi is currently the dominant player in the U.S. market. It operates as a federally regulated exchange overseen by the Commodity Futures Trading Commission (CFTC). This regulation allows it to offer a high degree of trust and seamless integration with U.S. bank accounts.

  • Availability to US Citizens: Fully Available. Kalshi is a U.S.-based company and is legal for residents in most states (though some states like Massachusetts and New Jersey have recently challenged or geofenced specific sports markets).
  • Event Types: Known for “macro” events. You can bet on Federal Reserve interest rate hikes, inflation data, Box Office totals, Rotten Tomatoes scores, and—most famously—elections. In late 2025, they expanded significantly into sports event contracts (e.g., NFL, NBA).

2. Polymarket

The Crypto Giant Polymarket is the world’s largest decentralized prediction market. Built on the Polygon blockchain, it uses the USDC stablecoin for all transactions. After being restricted in the U.S. for several years, it began a regulated comeback via a new legal framework in late 2025.

  • Availability to US Citizens: Limited / Phased Rollout. As of February 2026, Polymarket is returning to the U.S. through a regulated channel. While many U.S. users are still on waitlists, the platform is increasingly accessible compared to its previous “offshore-only” status.
  • Event Types: Unrivaled variety. Polymarket covers everything from global geopolitical conflicts and crypto price movements to pop culture “memes” and scientific breakthroughs. If it’s being talked about on the internet, there is likely a market for it on Polymarket.

3. PredictIt

The Political Laboratory PredictIt is a project of Victoria University of Wellington and serves primarily as an educational and research tool. Because it operates under a “no-action” letter from the CFTC (though this has been the subject of intense legal battles), it has strict limits on how much a single person can invest.

  • Availability to US Citizens: Fully Available. It is specifically designed for the U.S. market, though it has a $3,500 position limit per contract to keep it focused on research rather than institutional speculation.
  • Event Types: Politics only. PredictIt does not offer sports or weather. It focuses exclusively on U.S. elections, Supreme Court rulings, and legislative outcomes.

4. Robinhood (HOOD) & Interactive Brokers (IBKR) [ForecastEx]

The Traditional Entrants In the last year, major traditional brokerages have entered the fray. Robinhood now offers election and event contracts directly in its app, often routing orders through Kalshi’s infrastructure. Interactive Brokers launched ForecastEx, a dedicated exchange for economic and climate-related predictions.

  • Availability to US Citizens: Fully Available. These are standard U.S. financial institutions.
  • Event Types: Mostly focused on “serious” data: Economic indicators (CPI, unemployment), climate data (global temperature averages), and major political milestones.

While prediction markets are powerful forecasting tools, they are not “safe” investments like savings accounts. Because they are binary (paying out either $1 or $0), they carry unique risks that combine the volatility of tech stocks with the “all-or-nothing” nature of sports betting.

As of early 2026, these are the primary risks you face when trading these markets:


1. Regulatory & Legal Risk

The “legal status” of these platforms is a moving target. Even if a platform is federally regulated, state-level challenges remain a major hurdle.

  • State-Level Shutdowns: In early 2026, several states (including New Jersey and Maryland) issued cease-and-desist letters to platforms, claiming they bypass state gambling laws. You could find your account geofenced or restricted with little notice.
  • Tax Uncertainty: The IRS has not yet issued formal guidance on whether prediction market gains are “capital gains” or “gambling winnings.” This could lead to unexpected tax liabilities or penalties if you misreport your earnings.

2. Insider Trading & Information Asymmetry

Unlike the stock market, where insider trading is a strictly enforced crime, prediction markets often rely on insiders to move the price toward the “truth.”

  • The “Whale” Effect: Large traders with deep pockets or non-public information (e.g., a political staffer who knows a bill will fail) can move the price before you have a chance to react.
  • Enforcement Risk: On February 5, 2026, federal prosecutors in New York signaled they would begin charging traders who use “material non-public information” with wire fraud, moving toward a stricter enforcement era.

3. Liquidity & Execution Risk

Liquidity refers to how easily you can enter or exit a trade without significantly changing the price.

  • The “Exit” Problem: In “thin” markets (low volume), you might buy a contract at $0.60, but when you want to sell, the best buyer is only offering $0.50—even if no news has changed.
  • Slippage: If you try to place a large bet on a niche topic (like a specific scientific discovery), your own buy order might push the price from $0.30 to $0.45, instantly destroying your potential profit margin.

4. Platform & Technical Risk

Because many of these platforms use “Web3” or hybrid infrastructure, they face unique technical vulnerabilities.

  • Oracle Failure: A “Yes” or “No” payout depends on an Oracle (the data source that confirms the outcome). If an Oracle is hacked or provides ambiguous data, your funds could be locked in a dispute for months.
  • Account Security: In late 2025, a major breach of a third-party authentication provider highlighted that even if the “blockchain” is safe, the login screen might not be.

5. Manipulation & “Noise”

Prediction markets can be susceptible to intentional distortion.

  • Wash Trading: Some participants may trade back and forth with themselves to create the illusion of high volume and interest.
  • Propaganda Bets: Political campaigns or wealthy donors have been known to place massive bets to make their candidate look more likely to win in the media, creating a “narrative” that isn’t backed by actual data.

Keep these risks in mind before dipping your toe into predictive markets.

Disclosure: Author didn’t own any of the above stocks at the time the article was written. No recommendation are expressed or implied.

Is Stock Market Margin Debt Too High? Will It Cause a Crash?

by Fred Fuld III

You may think that investors use a lot less margin debt than in the past because of the increase in the use of put options to play the downside of stocks and ETFs.

However, margin debt has grown from $701 billion to $1.23 trillion since 2023.

Margin debt as a percentage of market cap of the stock market has gone from 1.6% to 2.3% $1.23 trillion over the last three years.

Tracking margin debt as a percentage of market capitalization is a classic “canary in the coal mine” for market analysts. Because the NYSE and NASDAQ combined represent nearly the entire US equity market, researchers often use the Wilshire 5000 or the S&P 500 as a proxy for total market cap.

Historically, FINRA (which took over reporting from the NYSE in 2008) provides the most reliable data starting from 1997. Below is a reconstructed table showing the approximate margin debt as a percentage of total US market capitalization (proxied by the Wilshire 5000 or S&P 500) over the last 30 years.

Historical Margin Debt vs. Market Capitalization (1996–2026)

YearApprox. Margin Debt ($B)% of Market CapMarket Context
1996~$1001.1%Pre-Dot-com buildup
2000$2782.6%Dot-com Bubble Peak
2002$1301.3%Post-bubble bottom
2007$3812.5%Pre-GFC Housing Peak
2009$1731.6%Post-GFC bottom
2014$4652.1%Steady recovery
2018$5542.3%Trade war volatility
2021$9352.0%Post-COVID Peak
2023$7011.6%Interest rate hike cooling
2024$8991.8%AI-driven rally
2025$1,2252.2%New Nominal Record
2026*$1,230+2.3%Current cycle highs

*Data through early 2026 based on recent FINRA January reports.


Key Observations

  • The 3% Ceiling: Historically, margin debt rarely exceeds 3% of the total market capitalization. When the ratio approaches or exceeds 2.5%, it is often viewed as a “yellow flag” indicating over-leverage and high speculative fervor.
  • Nominal vs. Relative Peaks: While the current 2026 nominal debt is at an all-time high (exceeding $1.2 trillion), the percentage of market cap is still lower than it was at the peak of the 2000 and 2007 bubbles because the total market value has grown even faster.
  • Forced Liquidation: The danger of high margin debt isn’t the borrowing itself, but the “feedback loop” it creates during a downturn. As stock prices fall, margin calls trigger forced selling, which further lowers prices and triggers more margin calls.

Disclosure: No investment recommendations are expressed or implied.