How to Get Your Paws on Some Pet Stocks

by Nkem Iregbulem

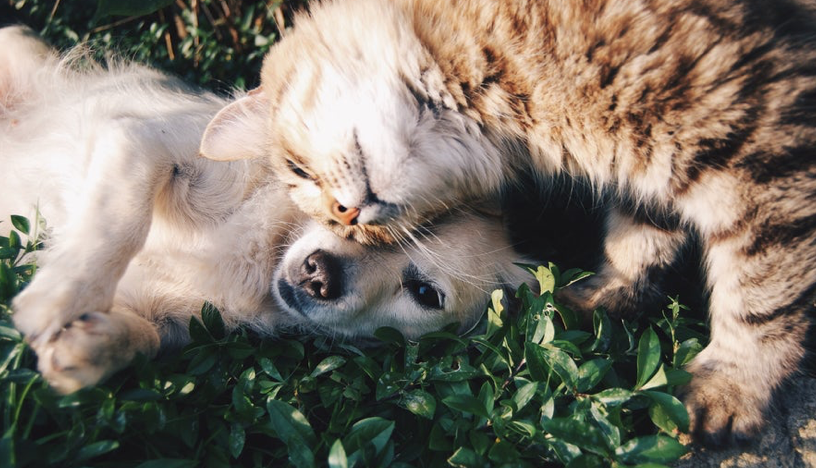
There’s no denying that Americans love their pets. More people own pets now than ever before. According to the American Pet Products Association’s 2017-2018 National Pet Owners Survey, 68% of U.S. households, or 85 million families, currently own pets — with a dog being the most commonly owned pet. The APPA also predicts that pet ownership will continue to grow over the next few decades.

As pet ownership rises, so does the amount of money that households spend to own and take care of their pets. A table in a report from the Insurance Information Institute provides total U.S. pet industry expenditure values from 2007 to 2017. The table indicates that these expenditures hit a high in 2017. In just that one year, Americans collectively spent approximately $69.1 billion dollars on their pets. This value has been on the rise since at least 2007 when expenditures in the pet industry stood at just $41.2 billion. Another table reports on the type and magnitude of expenses faced by cat and dog owners annually by survey participants. Reported annual expenses came from surgical and routine vet visits, food, food treats, toys, grooming, vitamins, and kennel boarding. Surgical vet visits were reported to cost around $474 annually for a dog and around $245 annually for a cat. Cat and dog owners in the survey also reported that they spend around $235 on pet food over the course of a year.

Given the continued increase in the amount of money we spend on pets, you may want look into pet stocks — stocks that benefit from this exact type of spending activity. Take a look at a few stocks, and you just might find yourself a treat. Your options include Patterson Companies Inc. (PDCO), Bayer AG (BAYRY), Henry Schein Inc. (HSIC), PetMed Express Inc. (PETS), Central Garden & Pet Co. (CENT), and Heska Corp. (HSKA). All of these stocks can be found on the NASDAQ exchange except for the BAYRY stock, which trades over-the-counter.

Your first option is Patterson Companies Inc., a medical supplies company involved in the research, development, and distribution of veterinary and dental supplies. The company was founded in 1877 and is headquartered in Minnesota. It has three operating segments: Dental, Animal Health, and Corporate. Under its Animal Health operating segment, it provides animal health services, technologies, and products such as pharmaceuticals, vaccines, diagnostics, antibiotics, equipment, and software to veterinarians, other animal health professionals, producers, and retailers. Patterson Companies Inc. has a market cap of $1.19 billion and pays a nice dividend yield of 4.63%. Its stock has a very favorable price-to-sales ratio of 0.39, which has been decreasing each fiscal year since 2013. It also has a trailing P/E ratio of 10.53 and a forward P/E ratio of 12.63.The company has a 5-year revenue growth rate of 8.49% and an even better 3-year revenue growth rate of 11.80%.

Based in Germany and founded in 1863, Bayer AG is a multinational pharmaceuticals and life science company. The company operates through its Pharmaceuticals, Consumer Health, Crop Science, and Animal Health segments. Under its Animal Health segment, the company researches, produces, and distributes prescription and nonprescription veterinary products and solutions to help prevent and treat diseases in companion and farm animals. Its main products include human and veterinary pharmaceuticals, biotechnology products, agricultural chemicals, and high value polymers. Bayer AG has a large market cap of $81.44 billion and pays a dividend yield of 2.92%. With a price-to-sales ratio of 2.38, the company’s stock is considered somewhat overpriced. It trades at 23.55 times trailing earnings and 14.03 times forward earnings. The stock also has a price-to-book ratio of 2.14. The company faces a negative 3-year growth rate of -5.38% and relatively better, but still negative 5-year revenue growth rate of -2.50%.

Another option is Henry Schein Inc., a company that distributes dental, medical, and veterinary healthcare supplies and products. The company was founded in 1932 and is headquartered in New York. It has two main operating segments, namely its Health Care Distribution segment and its Technology & Value-Added Services segment. Through these segments, it provides vaccines, pharmaceuticals, surgical products, equipment, and other products to its customers around the world. Henry Schein Inc. has a market $11.68 billion and does not pay a dividend yield. Its stock has a great price-to-sales ratio of 0.92 and a price-to-book ratio of 3.98. It trades at 27.50 times trailing earnings and 17.99 times forward earnings. Henry Schein Inc. has enjoyed increasing revenue values each fiscal year since 2013 as it boasts a 3-year revenue growth rate of 6.31% and a similar 5-year revenue growth rate of 6.87%.

You might also consider PetMed Express Inc., a Florida-based company founded in 1996. The company operates as a pet pharmacy and offers pet medications, supplements, and pet supplies such as food, beds, and crates for dogs and cats. With its pharmacy license, it sells both prescription and nonprescription pet medications. The company also frequently researches new healthcare products. PetMed Express Inc. has a market cap of $878 million and pays a dividend yield of 2.35%. A price-to-sales ratio of 3.25 suggests that the stock is overpriced. The stock also has a price-to-book ratio of 7.75. It trades at 23.93 times trailing earnings and 19.23 times forward earnings. The company’s revenue has been growing each fiscal year since 2015. PetMed Express Inc. enjoys a 5-year revenue growth rate of 3.74% and an even better 3-year revenue growth rate of 6.08%.

Founded in 1955, Central Garden & Pet Co. is a California-based company that distributes garden and pet supplies across the United States. It has two main operating segments: Pet and Garden. Under its Pet segment, the company offers products for dogs and cats such as edible bones, edible and nonedible chews, pet food, toys, carriers, treats, and grooming supplies. It also offers appropriate food and supplies for birds, fish, reptiles, and horses. These products are primarily sold to independent pet distributors, mass merchants, retail chains, grocery stores, and bookstores. Central Garden & Pet Co. has a market cap of $2.34 billion and does not pay a dividend yield. The company’s stock has a price-to-book ratio of 3.29 and a price-to-sales ratio of 1.10 — though this value has been on the rise since 2013. It trades at 21.60 times trailing earnings and 20.92 times forward earnings. With a 3-year revenue growth rate of 8.59% and a lower 5-year revenue growth rate of 3.86%, Central Garden & Pet Co. has seen increasing revenue values each fiscal year since 2014.

One more option is Heska Corp., a company founded in 1988 and headquartered in Colorado. The company manufactures, distributes, and sells veterinary diagnostic and specialty products. These products are primarily used in canine and feline healthcare markets. The company operates through two segments, namely its Core Companion Animal Health segment and its Other Vaccines, Pharmaceuticals and Products segment. Through the former, the company provides veterinary imaging instruments and services, veterinary chemistry analyzers, veterinary hematology analyzers, chewable treatment tablets, and allergy products. Through the latter, the company offers vaccines and biological and pharmaceutical animal health products to animal health companies and veterinarians. Heska Corp. has a market cap of  $791.53 million and does not pay a dividend yield. Its stock has a high price-to-sales ratio of 6.36, placing itself in the overpriced category. It also has a very high trailing P/E ratio of 113.26 and lower forward P/E ratio of 59.52. The stock also has a price-to-book ratio of 7.80. The company’s revenue increased each fiscal year from 2013 to 2016 before taking a very slight dip in 2017. Still, the company enjoys a 3-year revenue growth rate of 12.92% and a 5-year revenue growth rate of 12.18%.

Disclosure: Author did not own any of the above stocks at the time the article was written.


Can You Guess Warren Buffett’s Largest Stock Holding?

by Fred Fuld III

Warren Buffett, the head of Berkshire Hathaway (BRKA) (BRKB), is considered to be one of the top investors,  and is probably the most well known investor in the world. In addition, Buffett is a very interesting character.

Many investors like to copy Buffett’s investments, in order to match his superior returns.

So the first thing a copycat investor would do is to check and see what stock he owns more of than any other investment.  Can you guess what that stock is?

It is Apple Inc. (AAPL), the iPhone, iPad, Mac, and Apple Watch company. According the Berkshire Hathaway’s latest report to the SEC, Apple makes up 21.27% of the Berkshire Hathaway portfolio, a fairly large commitment. Buffett has 239 million shares worth over $40 billion.

The second largest shareholding is Wells Fargo (WFC), making up 12.66% of the Berkshire portfolio. In third place is Bank of America (BAC) at 10.78%.

Rounding out the top five shareholdings is Kraft Heinz (KHC) representing 10.74% of the portfolio and Coca-Cola (KO) at 9.19%.

To see all the stocks owned by Warren Buffett’s Berkshire Hathaway, so to the  Buffett Stock List.

Hopefully you can ride on Buffett’s coattails to investment success.


Disclosure: Author owns AAPL, BRKB, and BAC.

Investment and Business Books On Sale

Here is a list of the finance, investment, and business books that have recently gone on sale, and available on the Amazon (AMZN) Kindle. If you have any interest in these books, I suggest that you order them right away, as these sales don’t last long.

How to Talk to Anyone, Anytime, Anywhere
By Larry King with Bill Gilbert

The keys to successful communication in all areas of life.

$1.99 Retail: $11.99

Your Living Trust & Estate Plan
By Harvey J. Platt

The details of creating a living will and estate plan. Learn to save money and time with tips for everything from charitable deductions and lifetime exemptions to private annuities and protecting beneficiaries.

$1.99 Retail: $16.99

How to Speak Money
By John Lanchester

Explains the language of money without being confusing

$1.99 Retail: $9.62

The 1% Rule
By Tommy Baker

How some people turn their dreams of success into reality and how you can achieve your biggest goals in life.

$0.99 Retail: $9.99

The Power of Habit
By Charles Duhigg

How to increase productivity and achieve superior success.

$2.99 Retail: $12.99

Fill Your Funnel
By Tom Hopkins and Dan Portik

A step-by-step guide that gives you everything you need to convert posts on platforms like Facebook and Twitter into sales.

$1.99 Retail: $7.99

The Go-Giver
By Bob Burg and John David Mann
The five principles for monumental success shows that the secret to achievement lies in giving.
$1.99 Retail: $11.99

Start Something That Matters
By Blake Mycoskie

Written by the founder of TOMS Shoes, he shares a new blueprint for success.

$1.99 Retail: $13.99

The Substance of Style
By Virginia Postrel

Describes what makes consumers attracted to a product and how our sensory experiences guide our choices.

$1.99 Retail: $8.99

Creating Magic
By Lee Cockerell

Written by a former Walt Disney World executive, shares the keys to his success and leadership secrets.

$1.99 Retail: $12.99

Thinkertoys
By Michael Michalko

A guide to out-of-the-box thinking, including hands-on exercises and easy-to-follow tips.

$1.99 Retail: $12.99

Does It Pay to Buy an IPO Stock?

by Fred Fuld III and Nkem Iregbulem

Have you ever tried to get in on a hot Initial Public offering but missed out? Suppose you could have been able to get some shares on the IPO. Do you think it would have worked out?

We ran an analysis of a large selection of all the stocks that went public during the first half of the year, to determine how successful the IPO shareholders would have been. We looked at both the return on the day of the IPO and the return from the IPO to the end of June.

You will notice that of the 23 stocks, some of the stocks were down on the first day of trading but ended up year-to-date. One example is Evolus (EOLS), a provider of Botox aesthetic treatments and procedures. The stock was down 4% on the day of the IPO but increased by 128% from its IPO in February to the end of June.

The mean average of the percentage returns for the stocks on the day of the IPO was 5.78%. The overall mean average of the returns from the day of the IPO to the end of June was 18.84%. That is a decent return, especially when you consider that the S&P 500 was only up 0.8% over the same period.

The details can be found below:

Company Symbol IPO price End of IPO Day Price %chg Price End of June %chg
Neuronetics STIM 17.00 27.78 63% 27.78 63%
Entera Bio ENTX 8.00 6.28 -22% 5.99 -25%
HyreCar HYRE 5.00 5.10 2% 4.89 -2%
The Lovesac Company LOVE 16.00 23.99 50% 21.33 33%
Chicken Soup for the Soul CSSE 12.00 9.25 -23% 9.56 -20%
I3 Verticals IIIV 13.00 18.35 41% 14.75 13%
Magenta Therapeutics MGTA 15.00 14.52 -3% 13.68 -9%
ElectroCore LLC ECOR 15.00 19.85 32% 17.46 16%
Iterum Therapeutics ITRM 13.00 12.24 -6% 11.50 -12%
Hancock Jaffe Laboratories HJLI 5.00 5.24 5% 3.40 -32%
CLPS Incorporation CLPS 5.25 5.04 -4% 13.43 156%
Aslan Pharmaceuticals ASLN 7.03 5.61 -20% 7.78 11%
GrafTech International EAF 15.00 14.45 -4% 18.46 23%
Biofrontera BFRA 9.88 12.18 23% 11.99 21%
Motus GI Holdings MOTS 5.00 4.38 -12% 7.27 45%
Victory Capital VCTR 13.00 11.60 -11% 10.10 -22%
Evolus EOLS 12.00 11.50 -4% 27.32 128%
One Stop Systems OSS 5.00 4.88 -2% 4.45 -11%
Genprex GNPX 5.00 4.50 -10% 7.90 58%
Pagseguro Digital PAGS 21.50 29.20 36% 27.82 29%
EyeNovia EYEN 10.00 9.92 -1% 6.45 -36%
Nine Energy Service NINE 23.00 26.10 13% 33.04 44%
ADT ADT 14.00 12.39 -12% 8.46 -40%
AVERAGE 5.78% 18.84%


Top Stock Symbol Searches on Twitter

by Fred Fuld III

Twitter (TWTR) has become one of the leading social media services for posting stock trading and investing ideas. If you are wondering what stocks people are currently searching for, here is a list of the latest top searches.

Tesla TSLA
NeoGenomics NEO
BTC Health BTC
SysGroup SYS
APPC APPC
Alibaba BABA
Celgene CELG
DRGN DRGN
National Beverage FIZZ
MiMedx MDXG
Pan Orient POE
Real Biz Media RBIZ
WAN WAN

Why You Should Buy Fake Dirty Underwear

by Fred Fuld III

It is summer time when you do some traveling and are concerned about where to hide your money and valuables to keep them safe from burglars, whether at home or in a hotel. Many articles describe where you should and shouldn’t store treasures. Places of where you should not keep you valuables include your top dresser drawers, drawers in your nightstands, backs of closets, cookie jars, under your mattress, in the toilet tank, etc. Some experts recommend leaving burglars a ‘tip’; in other words a small amount of easily found cash so the burglars find it and leave without spending any more time looking.

Here is one anti-burglar tip suggestion I have that you may not be aware of. Gather up any old coins laying around that aren’t worth much or even not worth anything above face vale, but just look old. Put them in a box, put a label on it that says ‘coin collection’ and keep it in the top drawer of your chest of drawers. Keep your real coin collection in your safe deposit box, or if you must keep it at home, keep it in a place that is not obvious.

Let me tell you NEVER where to hide stuff. Never, ever store valuables at the bottom of a waste basket. The burglars may never look there, but you can be sure that at some point in the future, either you or a family member will accidentally throw out your valuables with the trash. [I am writing from personal experience. Fortunately, I was able to retrieve what was emptied before it was picked up by the trash collector.]

So what does all this have to do with dirty underwear? There is an interesting item called The Brief Safe and looks like dirty underwear with a place in it to conceal money, passports, credit cards, jewelry, memory cards, documents, and other valuables. The hidden compartment closes with Velcro. It even comes with its own stains to provide a major deterrence. I’ve given one away as a gift, and it was a hit.Have a happy, safe and secure vacation!

3D Printing’s Multidimensional Potential: Stocks, Houses, and Prosthetic Limbs

By Nkem Iregbulem

As 3D printers become increasingly common, the technology behind it is becoming more and more advanced. Still, many remain unaware of its full potential. Believe it or not, with current technology, 3D printers have already successfully printed medical models, eyeglasses, musical instruments, houses, prosthetic limbs, and even human body parts in a matter of hours.

3D printing describes the process by which three dimensional objects are created from a digital file. It is considered an additive process because it manufactures objects by laying down successive layers of a material. This process differs significantly from all other current, traditional manufacturing processes, which tend to depend on human labor. With time, 3D printing technology will inevitably change the way most industries operate. Since the efficiency of human labor can sometimes vary, 3D printing would be especially useful in industries that rely on mass production because the printer could operate around the clock to produce multiple copies of a product. Car manufacturers could print car parts, and construction companies could print building materials — or perhaps the buildings themselves.

3D printing would also benefit industries with companies that are constantly developing and tweaking new products. The technology would effectively reduce the amount of time it takes for suggested changes of a product to be implemented. This new ease might encourage companies to release higher quality products. 3D printing could even improve the healthcare industry. Hospitals could use these printers to construct human tissue or simply print more supplies. With the help of this technology, hospitals could save more lives. 

The huge potential for 3D printing technology may compel you to invest in 3D printing stocks. Your choices include 3D Systems (DDD), Autodesk, Inc. (ADSK), Organovo Holdings, Inc. (ONVO), Stratasys, Inc. (SSYS), Voxeljet A.G. (VJET), Materialise (MTLS), ExOne Company (XONE), and Proto Labs (PRLB). The DDD, PRLB, and VJET stocks are traded on the New York Stock Exchange. Meanwhile, the ADSK, ONVO, XONE, and MTLS stocks are all traded on the NASDAQ exchange.

You first option is 3D Systems, a company that offers 3D printing solutions, including 3D printers, print materials, software, on-demand manufacturing services, and 3D digital design tools. The company was founded in 1986 and is headquartered in South Carolina. Its customers come from a host of industries, ranging from healthcare to education to aerospace. Its products can be found on a factory floor, in an operation room, or at a product design shop. The company’s precision healthcare products pave the way for simulation, Virtual Surgical Planning, and even the printing of medical devices, dental devices, and personalized surgical instruments. The company has market cap of $1.62 billion but does not pay a dividend yield. With a price-to-sales ratio of 2.55, the stock is considered slightly overpriced. It trades at 100.0 times forward earnings and has a price-to-book ratio of 2.78. Though the company has a negative 3-year revenue growth rate of -0.39%, it has seen increasing revenue values from 2016 to 2017.

Autodesk, Inc. is another company in the 3D printing industry. The multinational software company, founded in 1982, offers its computer-aided design services and software to users in over 160 countries in a wide range of industries including entertainment, construction, architecture, media, engineering, and manufacturing. The company boasts a large market cap of $30.19 billion and does not pay a dividend yield. Its stock has a very high forward P/E ratio of 158.73. It has a price-to-sales ratio of 14.50, making the stock clearly overpriced. It also has an extremely high price-to-book ratio of 269.76. It has a negative 3-year revenue growth rate of -6.45% and 5-year revenue growth rate of -2.32%. It saw its highest revenue values in 2015 when it brought in around $2.51 billion.

Founded in 2007 and headquartered in California, Organovo Holdings, Inc is another interesting 3D printing company worth looking at. The company designs and creates functional, three dimensional, and structurally accurate human tissues with its powerful bioprinting technology. It uses these creations, made from living cells and biocompatible hydrogels, for drug development, research, and the treatment of damaged human tissues and organs. Ultimately, as it advances its technology, the company hopes to be able to produce whole human organs for use in future transplants. The company has a small market cap of $160.02 million, so its stock is very speculative. The stock has a high price-to-sales of 35.88, which has been decreasing over the past few years. It also has a price-to-book ratio of 3.84 and does not pay a dividend yield. The company enjoys an impressive 3-year revenue growth rate of 100.51% as its revenue has been increasing each fiscal year since 2014.

You may also want to consider Stratasys, Inc., a key player in 3D printing and additive manufacturing solutions. The company is based in Minnesota and was founded in 1989. Its product portfolio includes desktop 3D printers, rapid prototyping systems, and direct digital manufacturing production systems. These products are offered and used in industries ranging from education to aerospace. It also operates Thingiverse, a online platform where users share downloadable, digital 3D designs for future 3D printing projects. The company has a market cap of $1.02 billion but does not pay a dividend yield. Its stock has normal range price-to-sales ratio of 1.65. It trades at 68.49 times forward earnings and has a low price-to-book ratio of 0.96.

Founded in 1999 and headquartered in Germany, Voxeljet A.G. is another company involved in the 3D printing industry.  It has two main operating segments: the Systems segment and the Services segment. The Systems segment develops and distributes industrial 3D printing systems, while the Services segment provides on-demand parts and services to its customers. These industrial customers primarily come from entertainment, automotive, aerospace, construction, and engineering industries. The company has a small market cap of $68.45 million, so its stock is very speculative. It does not pay a dividend yield, and its stock is slightly overpriced with a price-to-sales ratio of 2.44. The stock also has a price-to-book ratio of 1.37. The company’s revenue grew each fiscal year from 2010 to 2015, but it took a small dip after 2015 before increasing again after 2016. The company boasts a 3-year revenue growth rate of 12.77% and an even higher 5-year revenue growth rate of 21.62%.

Materialise, founded in 1990, offers 3D printing services and additive manufacturing software. Although the company is based in Belgium, it also conducts its business internationally in countries such as Germany, Brazil, China, and Poland. Its products allow companies in industries spanning from healthcare to art and design to construct 3D printing applications. The company operates through three main segments: Software, Medical, and Manufacturing. Through these segments, the company offers rapid prototyping systems, 3D printed products, medical software, additive manufacturing software, computer-aided design packages, and many other useful products. The company has a market cap of $601.5 million but does not pay a dividend yield. Its stock has a price-to-sales ratio of 3.40, so it is considered overpriced. The stock also has a price-to-book ratio of 6.87 and an extremely high forward P/E ratio of 625.00. The company has seen increasing revenue values each fiscal year since 2012 and enjoys a 5-year revenue growth rate of 19.26% and a slightly better 3-year revenue growth rate of 20.56%.

Another option is ExOne Company, a company that develops and makes customizable 3D printing machines and 3D printed products. The Pennsylvania-based company was founded in 2005. It largely does business in North America, Europe, and Asia. Its products allow designers and engineers to design and make industrial prototypes and production parts. The company has a small market cap of $127.11 million, so its stock is very speculative. With a price-to-sales ratio of 2.17, the stock is slightly overpriced — though this value has been consistently decreasing in recent years. Revenue has been up each fiscal year since 2015 as the company enjoys a 3-year revenue growth rate of 9.57% and a 5-year revenue growth rate of 15.04%.

One last company to look into is Proto Labs, a company that was founded in 1999 and is headquartered in Minnesota. Using injection molding, 3D printing, injection molding, and sheet metal fabrication, the company manufactures custom parts for prototyping and short-run production. These parts are used by developers and engineers who design products for a variety of industries. The company has a market cap of $3.42 billion, and it does not pay a dividend yield. The stock has a high price-to-sales ratio of 9.21, so it is considered overpriced. It trades at 59.58 times trailing earnings and at 23.64 times forward earnings. The stock has a price-to-book ratio of 7.01. The company has seen impressive revenue growth each fiscal year since 2009, boasting a 3-year revenue growth rate of 18.02% and an even higher 5-year revenue growth rate of 22.28%.

Advancements in 3D printing technology and the efforts of companies involved in the industry have contributed to the notion that consumer ideas can actually be transformed into a reality. The technology has and will continue to change the way we think about, develop, and manufacture our products.


Disclosure: Author did not own any of the stocks above at the time the article was written.

Stocks Going Ex Dividend for the Month of July 2018

Here is our latest update on the stock trading technique called ‘Buying Dividends,’ also commonly referred to as ‘Dividend Capture.’ This is the process of buying stocks before the ex dividend date and selling the stock shortly after the ex date at about the same price, yet still being entitled to the dividend.

This technique generally works only in bull markets, and can work in flat or choppy markets, but you need to avoid the technique during bear markets. In order to be entitled to the dividend, you have to buy the stock before the ex-dividend date, and you can’t sell the stock until after the ex date.

The actual dividend may not be paid for another few weeks. WallStreetNewsNetwork.com has compiled a downloadable and sortable list of the stocks going ex dividend in the near future. The list contains many dividend paying companies, lots with market caps over $500 million, and yields over 2%. Here are a few examples showing the stock symbol, the ex-dividend date, the quarterly dividend amount, and annual yield.

American Express Company (AXP) 7/5/2018 0.35 1.39%
Barnes & Noble, Inc. (BKS) 7/5/2018 0.15 9.68%
Bristol-Myers Squibb Company (BMY) 7/5/2018 0.40 2.89%
Cisco Systems, Inc. (CSCO) 7/5/2018 0.33 2.84%
Ethan Allen Interiors Inc. (ETH) 7/9/2018 0.19 3.15%
Intuit Inc. (INTU) 7/9/2018 0.39 0.75%
Hormel Foods Corporation (HRL) 7/13/2018 0.19 1.95%
Colgate-Palmolive Company (CL) 7/17/2018 0.42 2.49%
Caterpillar, Inc. (CAT) 7/19/2018 0.86 2.28%
Foot Locker, Inc. (FL) 7/19/2018 0.35 2.40%
Lowe’s Companies, Inc. (LOW) 7/24/2018 0.48 1.69%
Clorox Company (CLX) 7/31/2018 0.96 2.63%
Hasbro, Inc. (HAS) 7/31/2018 0.63 2.57%

The additional ex-dividend stocks can be found here at wstnn.com. (If you have been to the website before, and the latest link doesn’t show up, you may have to empty your cache.) If you like dividend stocks, you should check out some of the other high yield stock lists at HERE or WStNN.com. Most of the lists are free.

Dividend definitions: Declaration date: the day that the company declares that there is going to be an upcoming dividend.

Ex-dividend date: the day on which if you buy the stock, you would not be entitled to that particular dividend; or the first day on which a shareholder can sell the shares and still be entitled to the dividend.

Monthly Dividend Stock List

Record date: the day when you must be on the company’s books as a shareholder to receive the dividend. The ex-dividend date is normally set for stocks at two business days before the record date.

Payment date: the day on which the dividend payment is actually made, which can be as long at two months after the ex date.

Don’t forget to reconfirm the ex-dividend date with the company before implementing this technique.

Disclosure: Author did not own any of the above at the time the article was written.


Cruise Line Shareholders Get Free Onboard Credit

by Fred Fuld III

It’s summer. Time for vacations. Many travelers are going on cruises. Fortunately, there’s a way to get a nice bonus on the cruise, free onboard credit up to $250. The only catch is that you need to be a shareholder of the cruise line, and own at least 100 shares.

For example, Carnival (CCL), which owns Carnival Cruise Lines and Holland America, is one of the companies offering free credit to shareholders of 100 shares or more. Here is what they offer:

  • Onboard credit per stateroom on sailings of 14 days or longer US $250
  • Onboard credit per stateroom on sailings of 7 to 13 days US $100
  • Onboard credit per stateroom on sailings of 6 days or less US $ 50

Carnival, which trades on the New York Stock Exchange,  has a price to earnings ratio of 17.5 and a forward P/E of 14.4, with a price to sales ratio of 2.56. It pays a decent yield of 2.83%.

Norwegian Cruise Line Holdings (NCLH), which trades on NASDAQ, offers shareholders the following:

  • $250 Onboard Credit per Stateroom on Sailings of 15 Days or More.
  • $100 Onboard Credit per Stateroom on Sailings of 7 to 14 Days.
  • $50 Onboard Credit per Stateroom on Sailings of 6 Days or Less.

Norwegian trades at 14.9 times trailing earnings and 11.0 times forward earnings. The price sales ratio is 2.15, and the company does not pay a dividend.

Finally, Royal Caribbean Cruises (RCL), operator of the Royal Caribbean International, Celebrity Cruises, and Azamara Club Cruises, is the second largest cruise line operator after Carnival. It offers onboard credits of:

  • $250 Onboard Credit per Stateroom on Sailings of 14 or more nights.
  • $200 Onboard Credit per Stateroom on Sailings of 10 to 13 nights.
  • $100 Onboard Credit per Stateroom on Sailings of 6 to 9 nights.
  • $50 Onboard Credit per Stateroom on Sailings of 5 nights or less.

RCL has a PE of 14.6, a forward PE of 12.5, and a PS ratio of 2.73. The yield is a favorable 2.15%.

Just keep in mind that just because a cruise line company offers onboard credits, does not mean that the stock is a good investment. Nor should you buy shares in the stock just to get the free credit. However, maybe your ship will come in with one of these stocks.

Disclosure: Author didn’t own any  of the above at the time the article was written.

A Positive Outlook on Beer and Beer Stocks

by Nkem Iregbulem

Beer, one of the oldest beverages ever made by man, is a popular alcoholic beverage enjoyed by many around the world. The chemical analysis of old clay tablets revealed that the production of beer dates back to at least 3500 BC in modern day Iran. Beer was discovered — some believe unintentionally — when grains from bread were left unattended and started to ferment.

Beer grew popular in different areas for different reasons. In some places, beer became popular because it was often cleaner than the water that they had available to them in nearby rivers and canals. In other locations, beer became popular because of its taste and its effects on the drinker. Over time, the ingredients used to make the drink changed. Initially, Egyptians used barley for their beer, but eventually in the Middle Ages, Christian monks and other artisans started to replace barley with hops. Beer has now evolved such that we wouldn’t classify the early Europeans’ version of the drink as the beer we know today.

Are you tired of beer’s bad reputation when it comes to nutrition? Do you enjoy winding down with a beer or two every now and then? You’ll be both surprised and glad to hear that beer, consumed in moderation, might actually be beneficial to your health in a couple of ways.

A study, led by Shue Huang from Penn State and conducted in China, found that the moderate consumption of beer was associated with a slower decline in HDL levels. HDL, or high-density lipoprotein, is thought to be the good kind of cholesterol. The study defined moderate consumption as a 0.5 to 1 twelve-ounce serving of beer for women and 1 to 2 twelve-ounce servings of beer for men. The study tracked close to 80,000 subjects over a six-year period to obtain its results. Even though HDL levels generally decreased over time for all participants, they found that this decline was slowest among moderate drinkers. Since HDL levels act as an indicator for the risk of cardiovascular disease, the results suggested to researchers that drinking beer in moderation may lower one’s risk of cardiovascular diseases.

Two other studies have suggested that beer may even improve bone health. The first study, published in the Journal of the American Medical Association, found that those who drank beer in moderation were 38% less likely to have osteoporosis — a very common bone disease — than those who did not consume beer. The second study, published in Osteoporosis International, saw similarly protective effects. Its results indicated that people who consumed beer in moderation faced a 20% lower risk of hip fractures than non-drinkers. Since dietary silicon is both found in beer and tied to bone growth and development, researchers suspected that this ingredient may play a role in beer’s potential bone health benefits.

Other studies have found that beer may also help prevent diabetes, cancer, and obesity and even boost creativity.

If you’re looking for more than just health benefits from beer, you could invest your money in companies involved in the beer industry. Your options for beer-related companies include: Anheuser-Busch InBev (BUD), Craft Brew Alliance, Inc. (BREW), Heineken NV (HEINY), Molson Coors Brewing (TAP), and Granite City Food & Brewery (GCFB). Some of these names may be more familiar to you than others. The BUD and TAP stocks are both traded on the New York Stock Exchange, and the BREW stock is traded on the NASDAQ exchange. Meanwhile, the HEINY and GCFB stocks are both traded over-the-counter.

Anheuser-Busch InBev is a brewing company involved in the production, distribution, and sale of beer, alcoholic beverages, and soft drinks. The company is headquartered in Belgium and was founded in 1366. Popular brands under the company include Budweiser, Corona, and Becks. As of late, the company has around 500 beer brands under its name. It splits these brands into three main categories: International Brands, Global Brands, and Local Champions. Its brand portfolio also includes some popular soft-drink brands. As the world’s largest brewery, the company boasts a very large market cap of $156.81 billion and pays a generous dividend yield of 4.43%. Given its price-to-sales ratio of 3.41, the stock is considered somewhat overpriced. It trades at 25.94 times trailing earnings and at 19.19 times forward earnings. The stock also has a price-to-book ratio of 2.17. The company faces a negative 3-year revenue growth rate of -2.92%, and its revenue has been decreasing each fiscal year since 2016.

Founded in 1981, Craft Brew Alliance, Inc. is a beer brewing company based in Portland, Oregon and involved in the brewing and selling of craft beers and ciders in the United States and in various other countries. Its brand portfolio includes brands such as Kona Brewing Company, Widmer Brothers Brewing, and Redhook Ale Brewery. Craft Brew Alliance has two operating segments: Beer Related operations and Brewpubs operations. However, most of the company’s revenue comes from brewing and its sales of craft beers and ciders domestically and internationally as part of the company’s Beer Relation operations segment. It sells its products through liquor stores, restaurants, bars, supermarkets, and convenience stores. The company has a market cap of $382.82 million but does not pay a dividend yield. Its stock has a normal price-to-sales ratio of 1.83 and a price-to-book ratio of 2.92. It trades at 33.56 times trailing earnings and at 33.67 times forward earnings. The company’s revenue has been increasing each fiscal year since 2016, contributing to its 3-year revenue growth rate of 1.22%.

Many people have heard of Heineken NV, a company based in Netherlands and founded in 1864. It brews and sells beer and cider around the world. Heineken is the largest cider producer in the world, and after only Anheuser-Busch InBev, it is the second largest brewer in the world. Its operating segments include Americas, Middle East & Eastern Europe, Africa, Asia Pacific, and Europe. Well-known brands under the company include Heineken, Amstel, Desperados, and Sol. Within its brand portfolio, you can find Belgian, craft, and even non-alcoholic beer. Its products can be found at retailers, bars, and restaurants. As Western Europe’s largest beer producer, the company boasts a very large market cap of $58.34 billion and pays a dividend yield of 1.56%. With a price-to-sales ratio of 2.30, the stock is slightly overpriced. It trades at 25.89 times trailing earnings and at 21.23 times forward earnings. It also has a price-to-book ratio of 3.77. Heineken NV enjoys a 3-year revenue growth rate of 4.36% as its revenue has been increasing each fiscal year since 2008.

Molson Coors Brewing is a multinational company that manufactures and sells beers globally. The company is based in Colorado and was founded in 1786. You may have heard of a few of the brands in its portfolio: Coors Light, Miller Lite, Molson Canadian, and Carling. Most of Molson Coors Brewing’s sales and operating profits come from the company’s business in the United States, followed by Canada and then Europe. As the second largest brewer by volume in the United States, the company has a market cap of $14.3 billion and pays a dividend yield of 2.48% — up from last year. The company has a price-to-sales ratio of 1.3 and a low price-to-book ratio of 1.06. It trades at 11.96 times trailing earnings and at 13.23 times forward earnings. Molson Coors Brewing enjoys a great 3-year revenue growth rate of 38.45% and its revenue has been increasing each fiscal year since 2015.

Based in Minnesota and founded in 1997, Granite City Food & Brewery is an upscale casual restaurant chain in the United States that produces its signature brews on-site at its restaurants. It operates two dining concepts called Granite City Food & Brewery and Cadillac Ranch All American Bar & Grill. At the former, you will find various menu items as well as handcrafted beer. At the latter, you will find authentic cuisines ranging from pasta to tasty meatloaf. Granite City Food & Brewery has a tiny market cap of $4.31 million, so its stock is very speculative. It also has an excellent, low price-to-sales ratio of 0.03. The company has a 3-year revenue growth rate of 3.86% and an even better 5-year revenue growth rate of 10.02%. Its revenue increased each fiscal year between 2009 and 2015, before dipping slightly in 2016.

Hopefully your beer stocks will perform well and you can celebrate with a couple of beers.

Disclosure: Author didn’t own any of the above at the time the article was written.